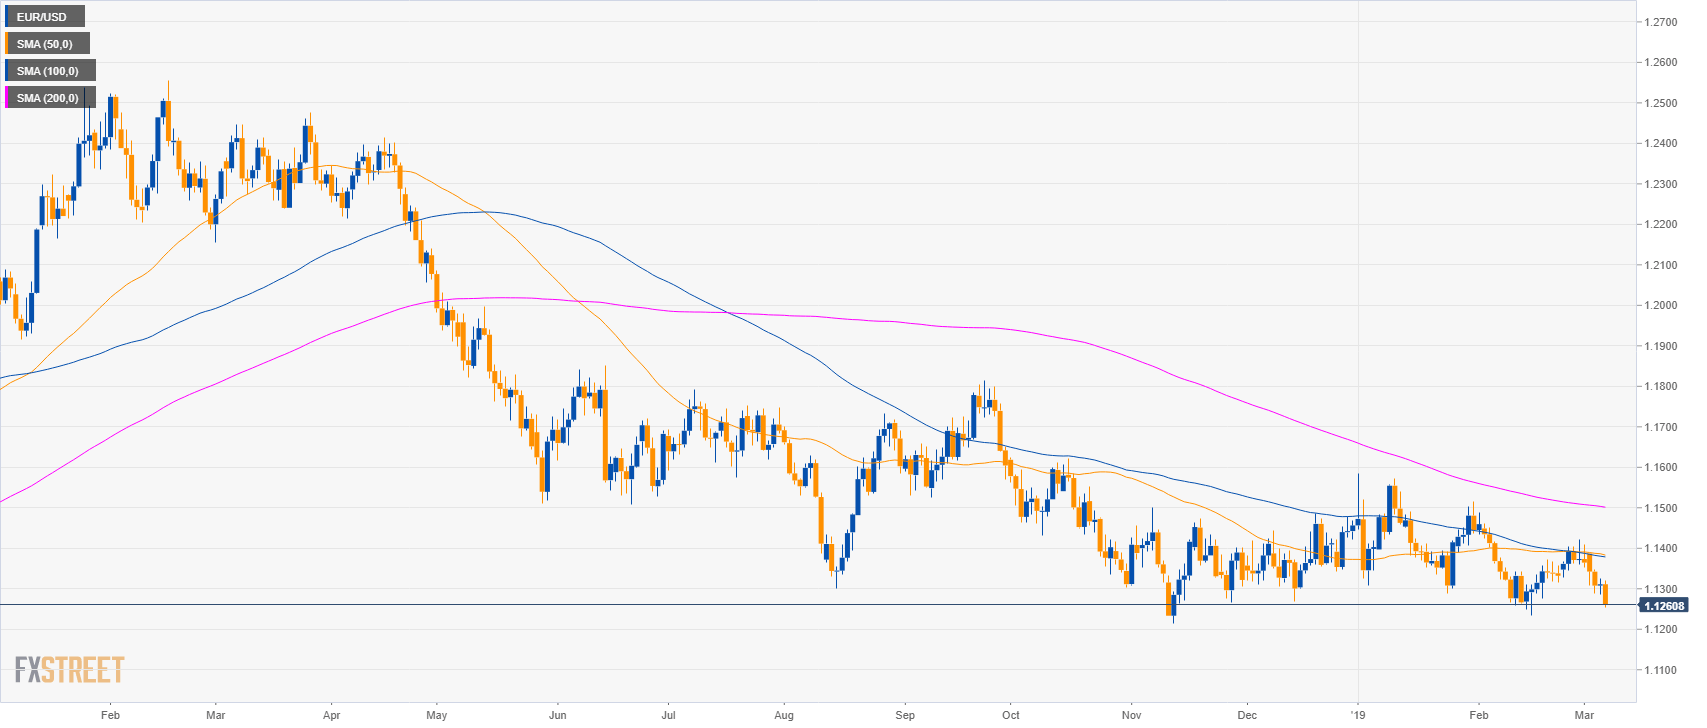
EUR/USD daily chart
- EUR/USD is trading in a bear trend below its main simple moving averages.
- Dovish comments from Mario Draghi, the President of the European Central Bank (ECB) sent the currency pair about 60 pips down near 1.1250 level.
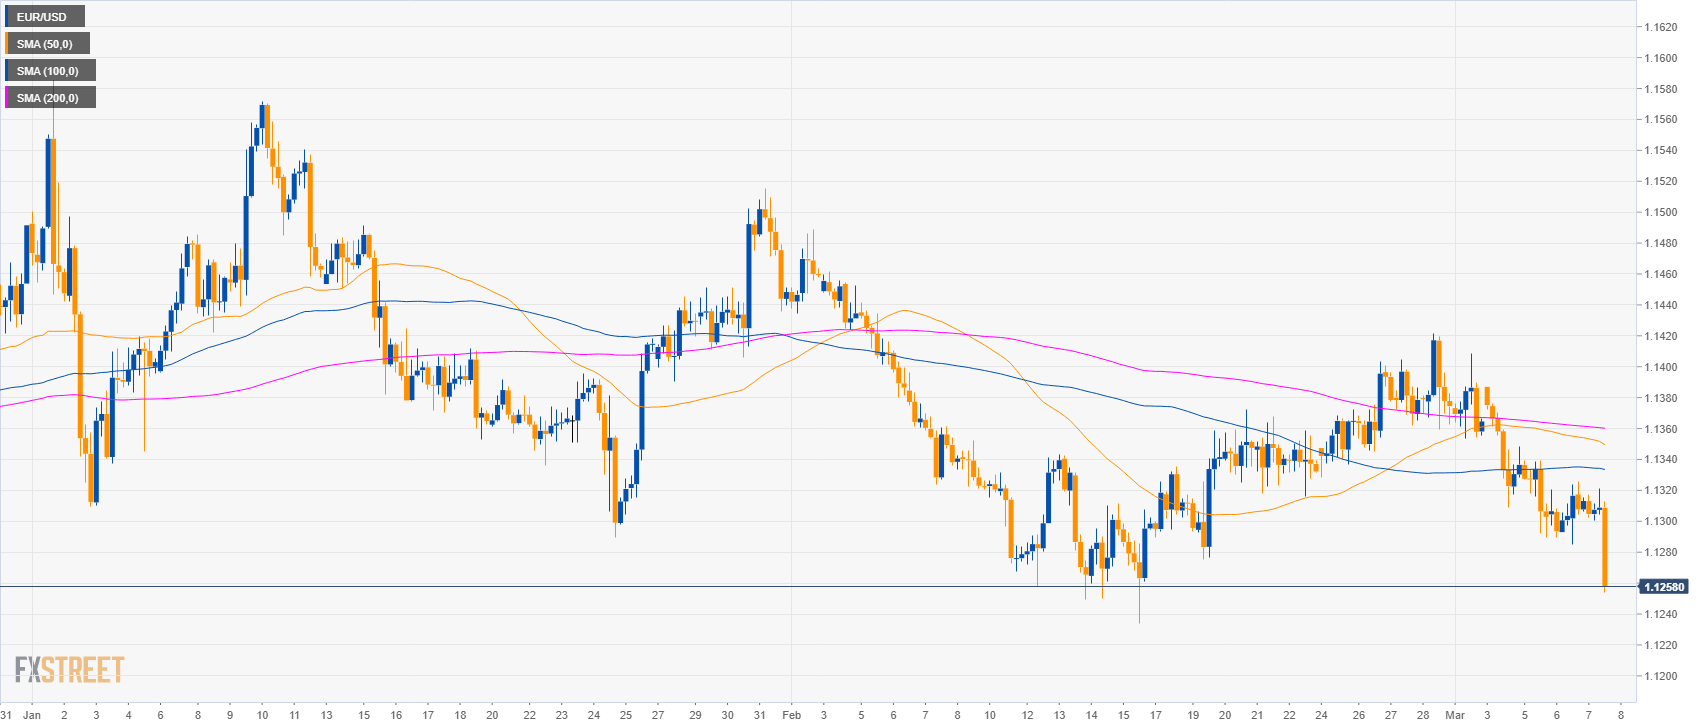
EUR/USD 4-hour chart
- EUR/USD is trading below its main SMAs suggesting a bearish bias in the medium-term.
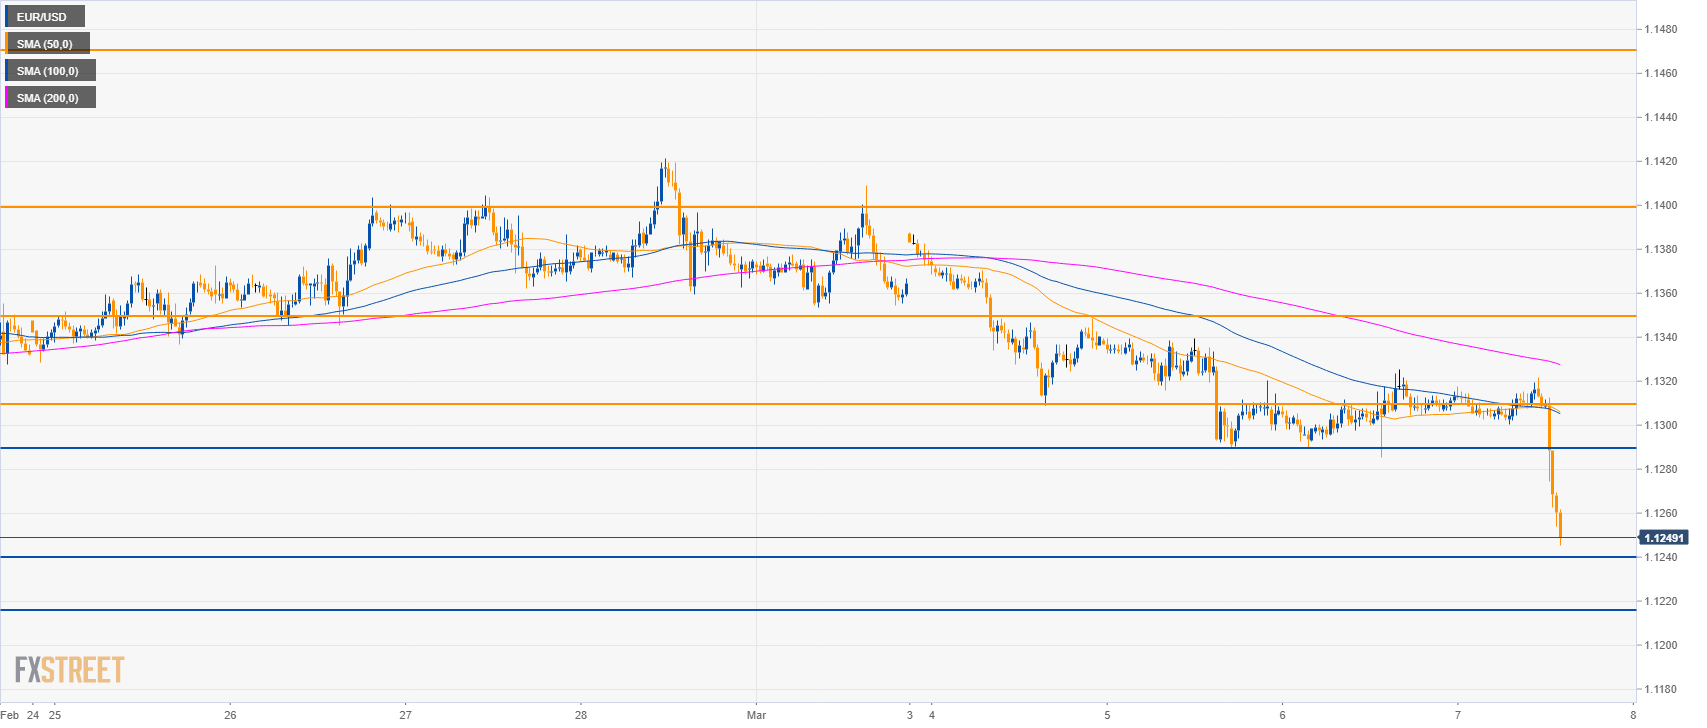
EUR/USD 30-minute chart
- EUR/USD is trading below its main SMAs suggesting bearish momentum in the short-term.
- The next support levels to the downside are seen at 1.1240 and 1.1215 level.
- Resistances are at 1.1290 and 1.1350 level.
Additional key levels
EUR/USD
Overview:
Today Last Price: 1.126
Today Daily change: -51 pips
Today Daily change %: -0.45%
Today Daily Open: 1.1311
Trends:
Daily SMA20: 1.1331
Daily SMA50: 1.1387
Daily SMA100: 1.1381
Daily SMA200: 1.1504
Levels:
Previous Daily High: 1.1326
Previous Daily Low: 1.1285
Previous Weekly High: 1.1422
Previous Weekly Low: 1.1328
Previous Monthly High: 1.1489
Previous Monthly Low: 1.1234
Daily Fibonacci 38.2%: 1.131
Daily Fibonacci 61.8%: 1.1301
Daily Pivot Point S1: 1.1289
Daily Pivot Point S2: 1.1267
Daily Pivot Point S3: 1.1249
Daily Pivot Point R1: 1.1329
Daily Pivot Point R2: 1.1348
Daily Pivot Point R3: 1.1369
