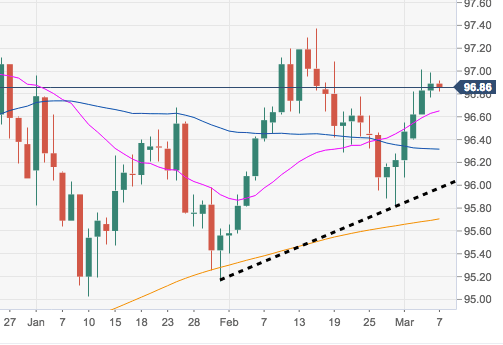
- The rally in the greenback seems to have met a solid resistance in the 97.00 neighbourhood for the time being.
- Further bullish attempts in the greenback are expected in the near term, always with the immediate target at the YTD peaks near 97.40.
- Furthermore, the positive outlook on DXY should remain above the 200-day SMA at 95.70 and the short-term support line at 95.97.
DXY daily chart
Dollar Index Spot
Overview:
Today Last Price: 96.86
Today Daily change: 10 pips
Today Daily change %: -0.03%
Today Daily Open: 96.89
Trends:
Daily SMA20: 96.64
Daily SMA50: 96.28
Daily SMA100: 96.51
Daily SMA200: 95.69
Levels:
Previous Daily High: 96.99
Previous Daily Low: 96.77
Previous Weekly High: 96.61
Previous Weekly Low: 95.82
Previous Monthly High: 97.37
Previous Monthly Low: 95.4
Daily Fibonacci 38.2%: 96.91
Daily Fibonacci 61.8%: 96.85
Daily Pivot Point S1: 96.78
Daily Pivot Point S2: 96.66
Daily Pivot Point S3: 96.56
Daily Pivot Point R1: 97
Daily Pivot Point R2: 97.1
Daily Pivot Point R3: 97.22
