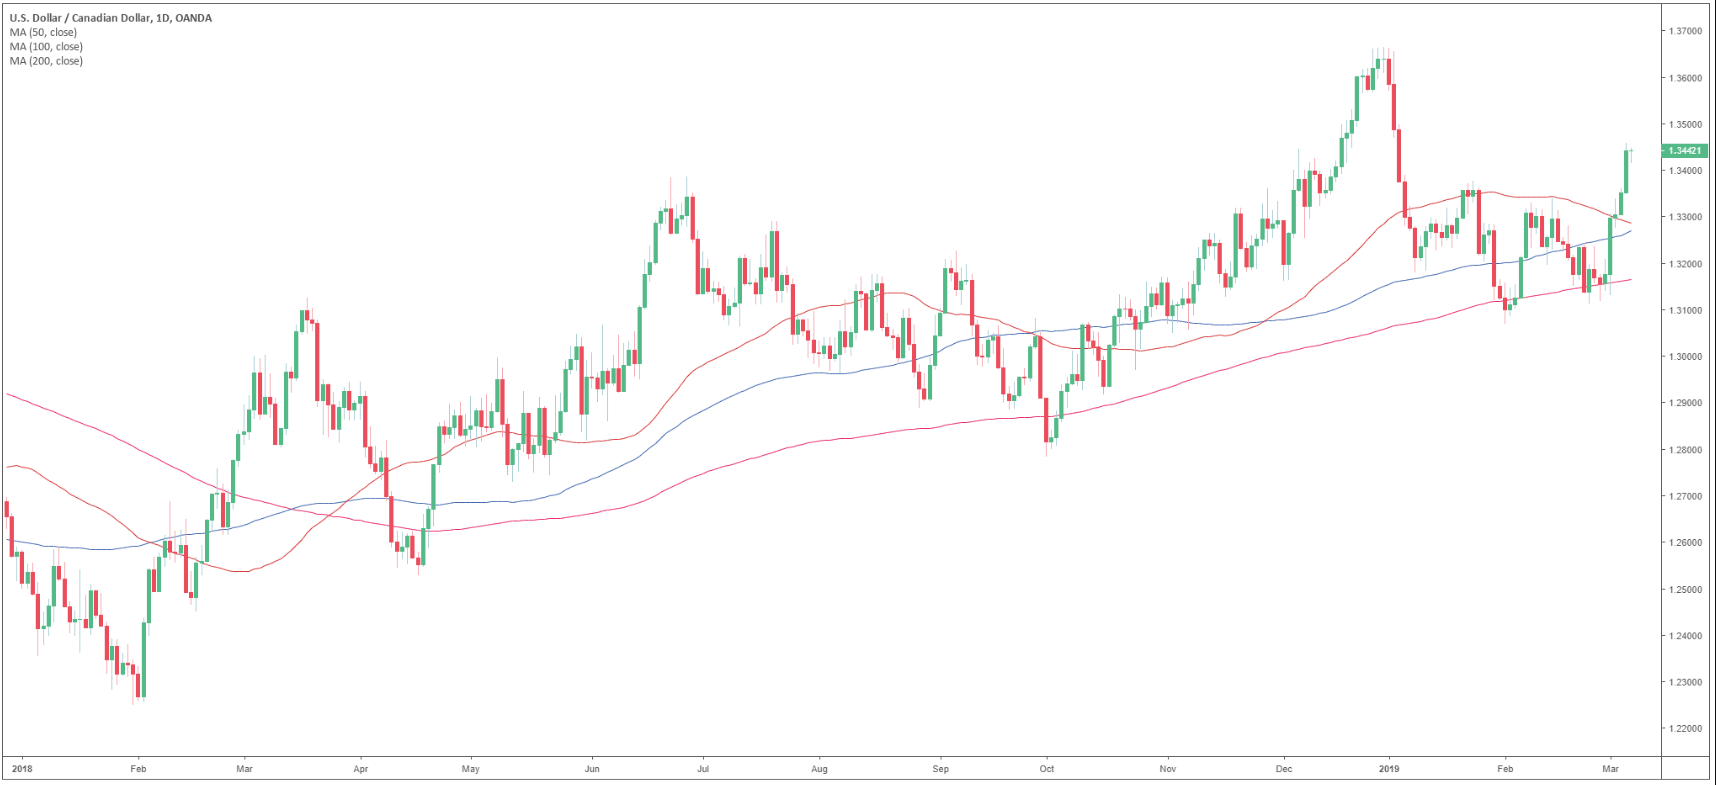
USD/CAD daily chart
- USD/CAD is trading in a bull trend above its main simple moving averages (SMAs).
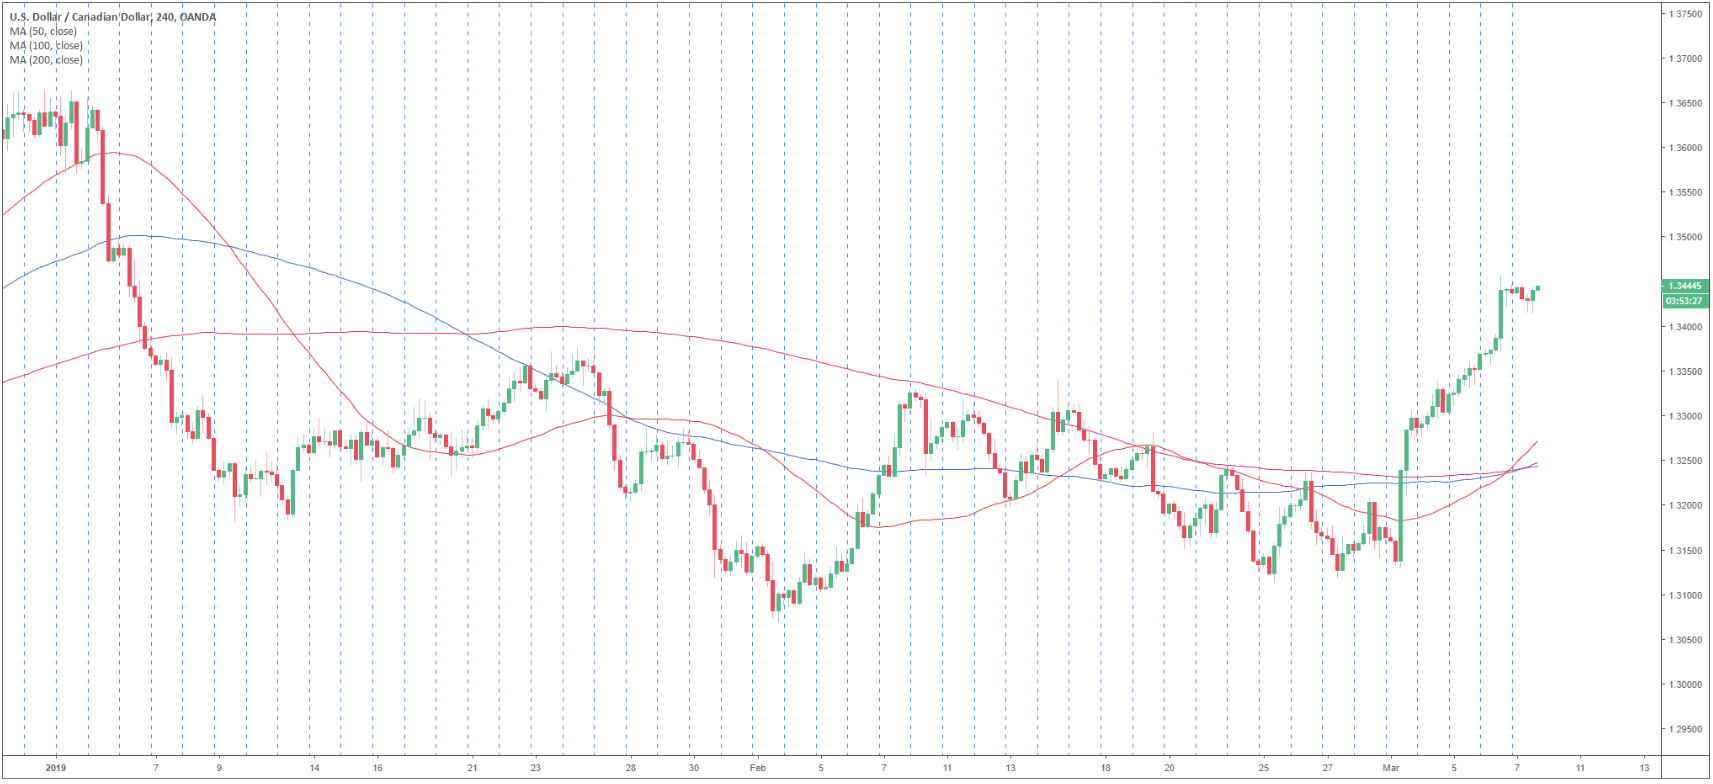
USD/CAD 4-hour chart
- USD/CAD is trading above its main SMAs suggesting a bullish bias in the medium-term.
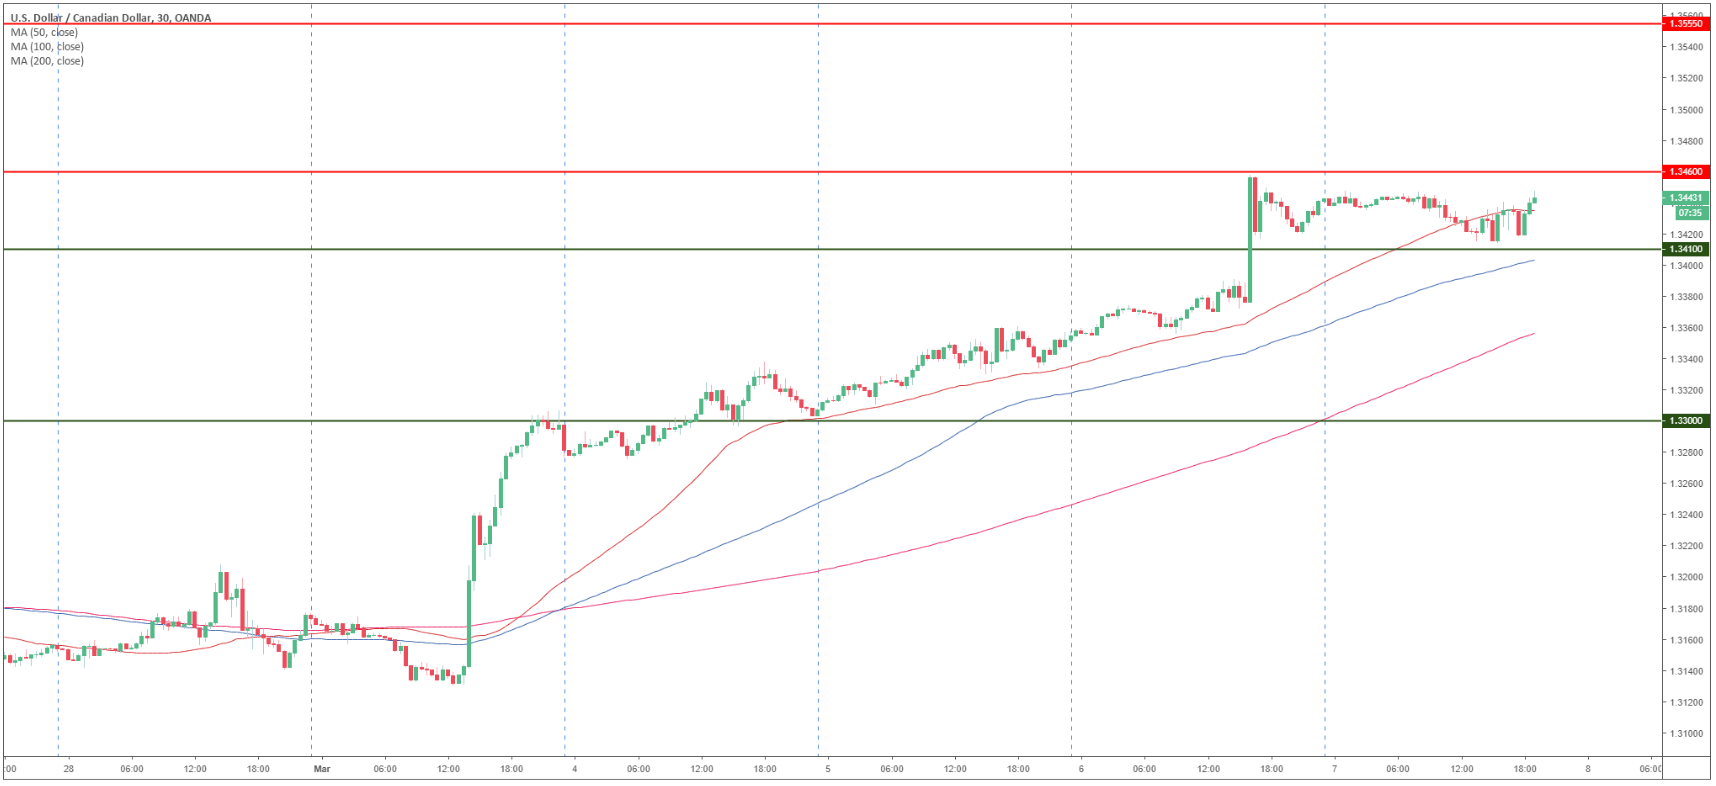
USD/CAD 30-minute chart
- USD/CAD is trading above its main SMAs suggesting bullish momentum in the short-term.
- Resistances to the upside are seen at 1.3460 and 1.3555 level.
- On the way down, supports are seen at 1.3410 and 1.3300 support.
Additional key levels
USD/CAD
Overview:
Today Last Price: 1.3444
Today Daily change: 10 pips
Today Daily change %: 0.07%
Today Daily Open: 1.3434
Trends:
Daily SMA20: 1.3248
Daily SMA50: 1.3291
Daily SMA100: 1.3282
Daily SMA200: 1.3172
Levels:
Previous Daily High: 1.3458
Previous Daily Low: 1.3344
Previous Weekly High: 1.3308
Previous Weekly Low: 1.3112
Previous Monthly High: 1.3341
Previous Monthly Low: 1.3069
Daily Fibonacci 38.2%: 1.3414
Daily Fibonacci 61.8%: 1.3388
Daily Pivot Point S1: 1.3367
Daily Pivot Point S2: 1.3299
Daily Pivot Point S3: 1.3254
Daily Pivot Point R1: 1.348
Daily Pivot Point R2: 1.3525
Daily Pivot Point R3: 1.3593
