- WTI struggles around ten-week-old support-line, at $56.05 now, during early Friday.
- The energy benchmark previously reversed from the trend-line on Wednesday, which in turn signifies the importance of support.
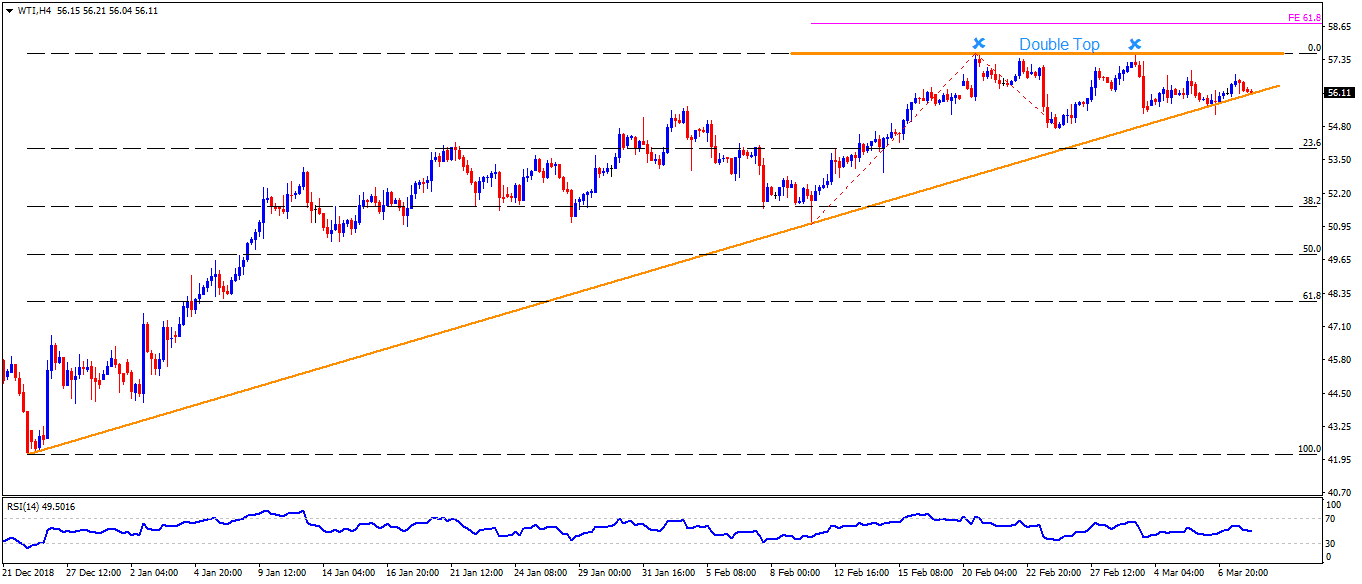
- Should the quote takes a U-turn from present levels, $56.80 and $57.15 can offer intermediate halts during its rally to $57.60 mark indicated as “Double Top”.
- In case prices rise above $57.60, 61.8% Fibonacci expansion (FE) level of February month moves at $58.80, can offer intermediate halt ahead of pushing Bulls to $59.60 and $60.00
- Alternatively, $55.20 and $54.60 are likely immediate supports prior to 23.6% Fibonacci retracement of December – February upside, at $53.90.
- Given the sellers’ dominance under $53.90, $52.80 and $51.70 can come back on the chart.
WTI 4-Hour chart