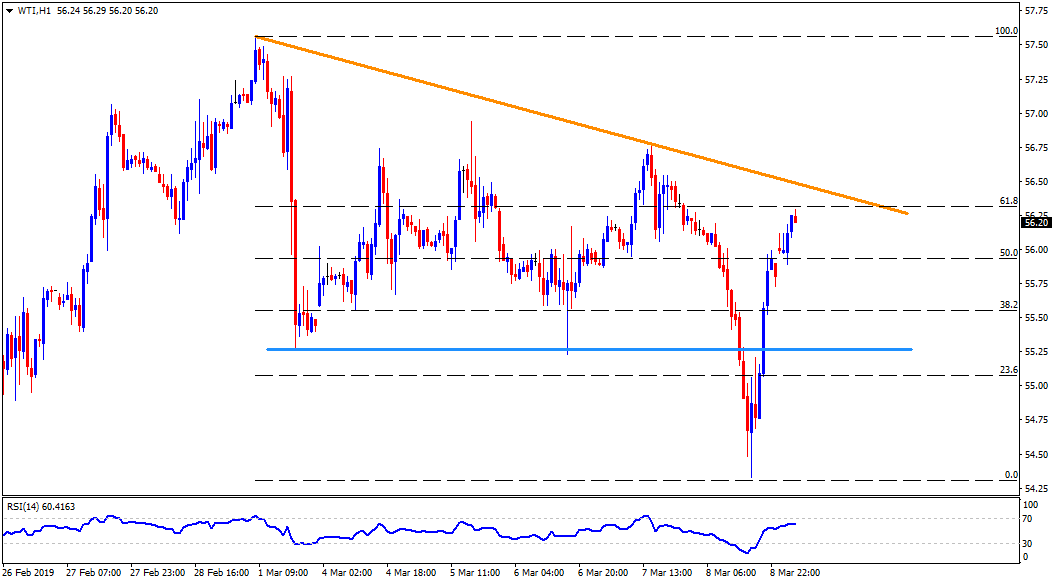
WTI daily chart
- WTI is on bid near $56.40 at the initial Monday trading hours.
- The energy benchmark recently recovered from 100-day simple moving average (SMA) figure around $54.60, which in-turn highlights double-top region around $57.85/93.
- Should the quote cross $57.93, chances of witnessing $61.00 on the chart can’t be denied.
- Alternatively, break of $54.60 SMA support can avail $53.00 and $51.30 as following rests ahead of aiming $50.00 round-figure.
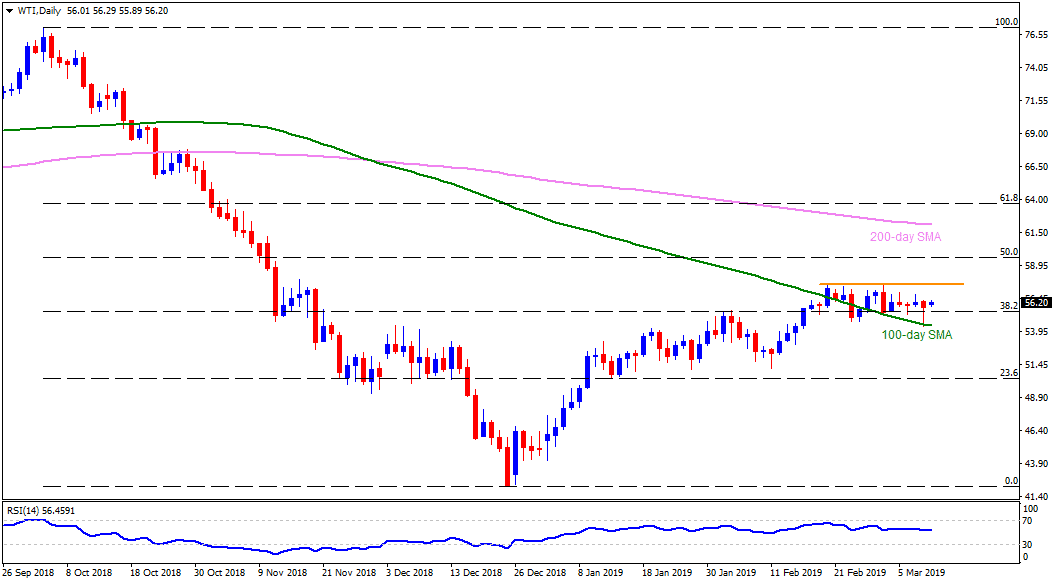
WTI 4-Hour chart
- A descending trend-line connecting recent highs around $56.75/80 could restrict immediate upside ahead of diverting buyers to $57.93.
- Also, $54.90 might offer nearby support before $54.60 comes into play.
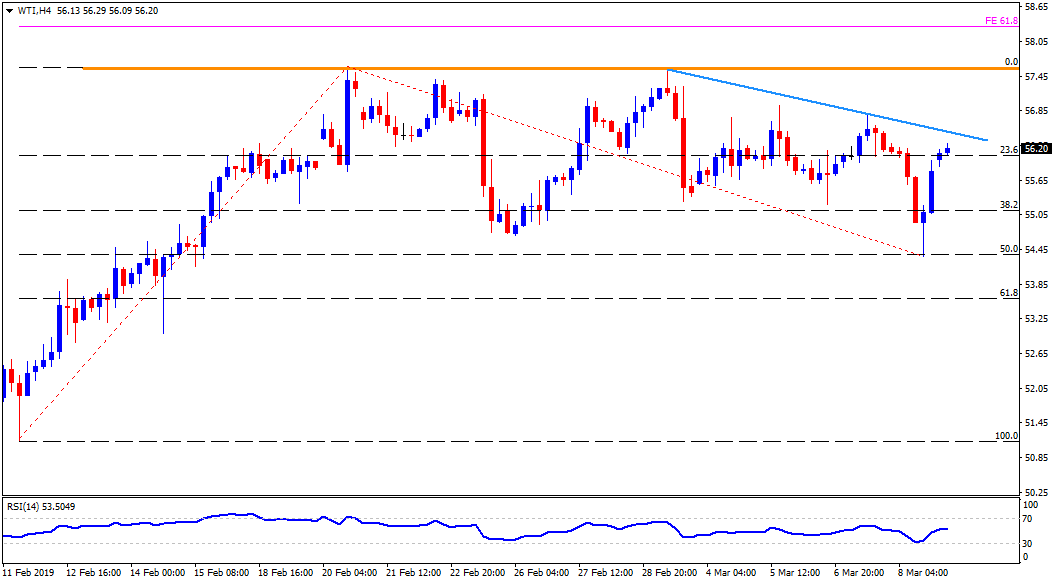
WTI hourly chart
$55.50 is likely closest support with $57.55 being another intermediate halt to the upside.