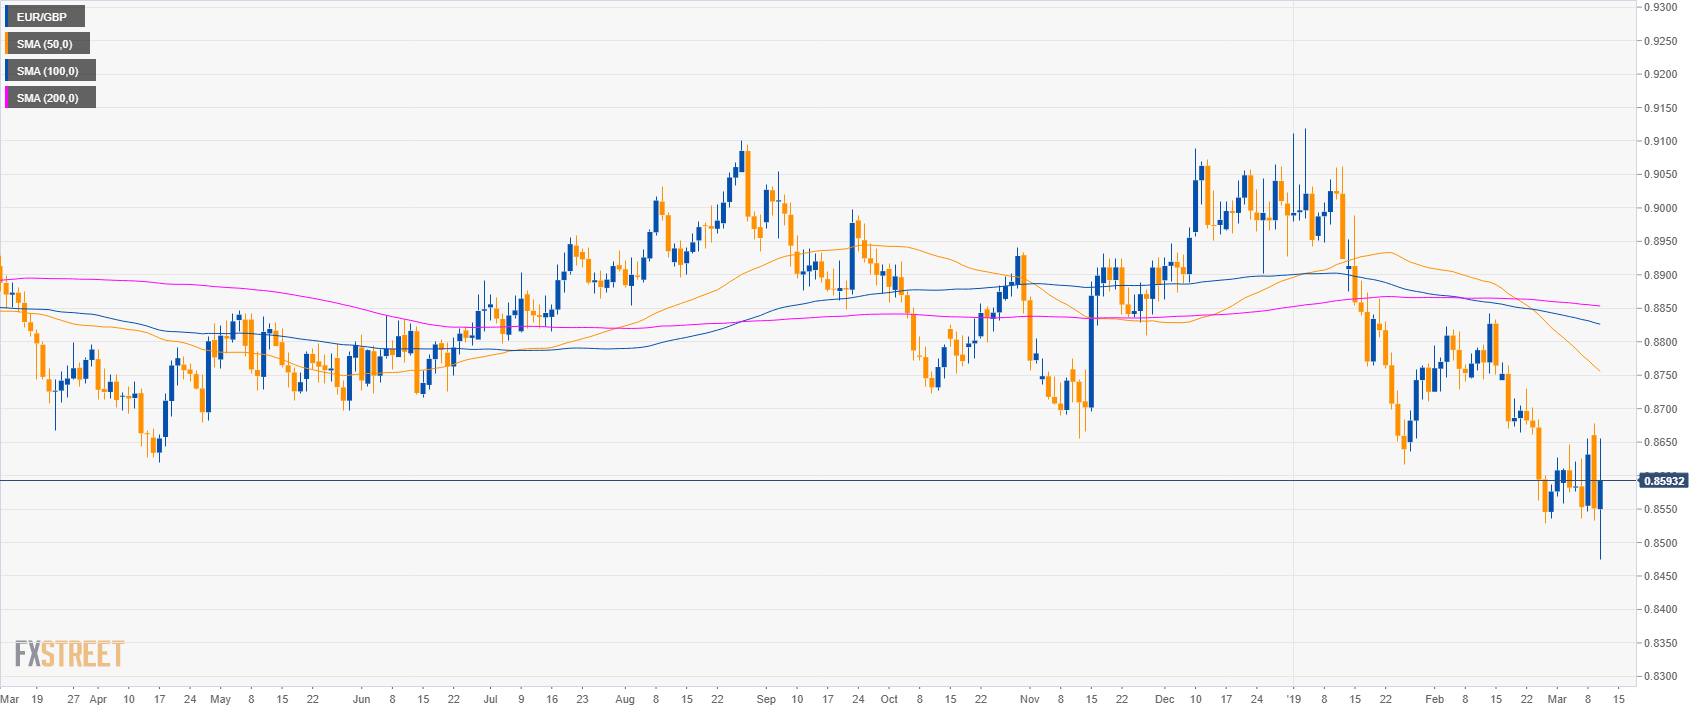
EUR/GBP daily chart
- EUR/GBP is trading in a sideways trend below its main simple moving averages (SMAs).
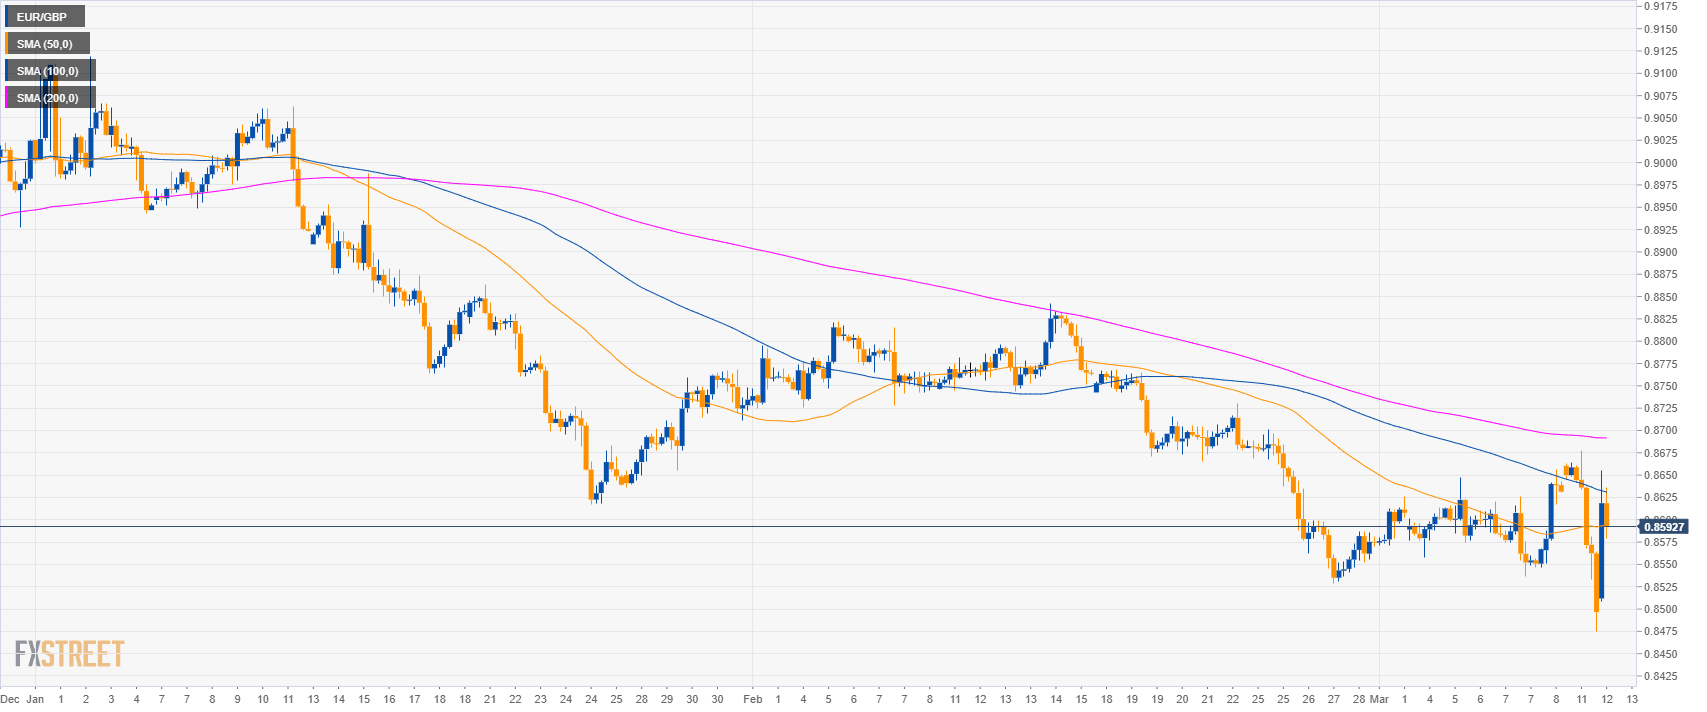
EUR/GBP 4-hour chart
- EUR/GBP is trading below its main SMAs suggesting a bearish momentum in the medium-term.
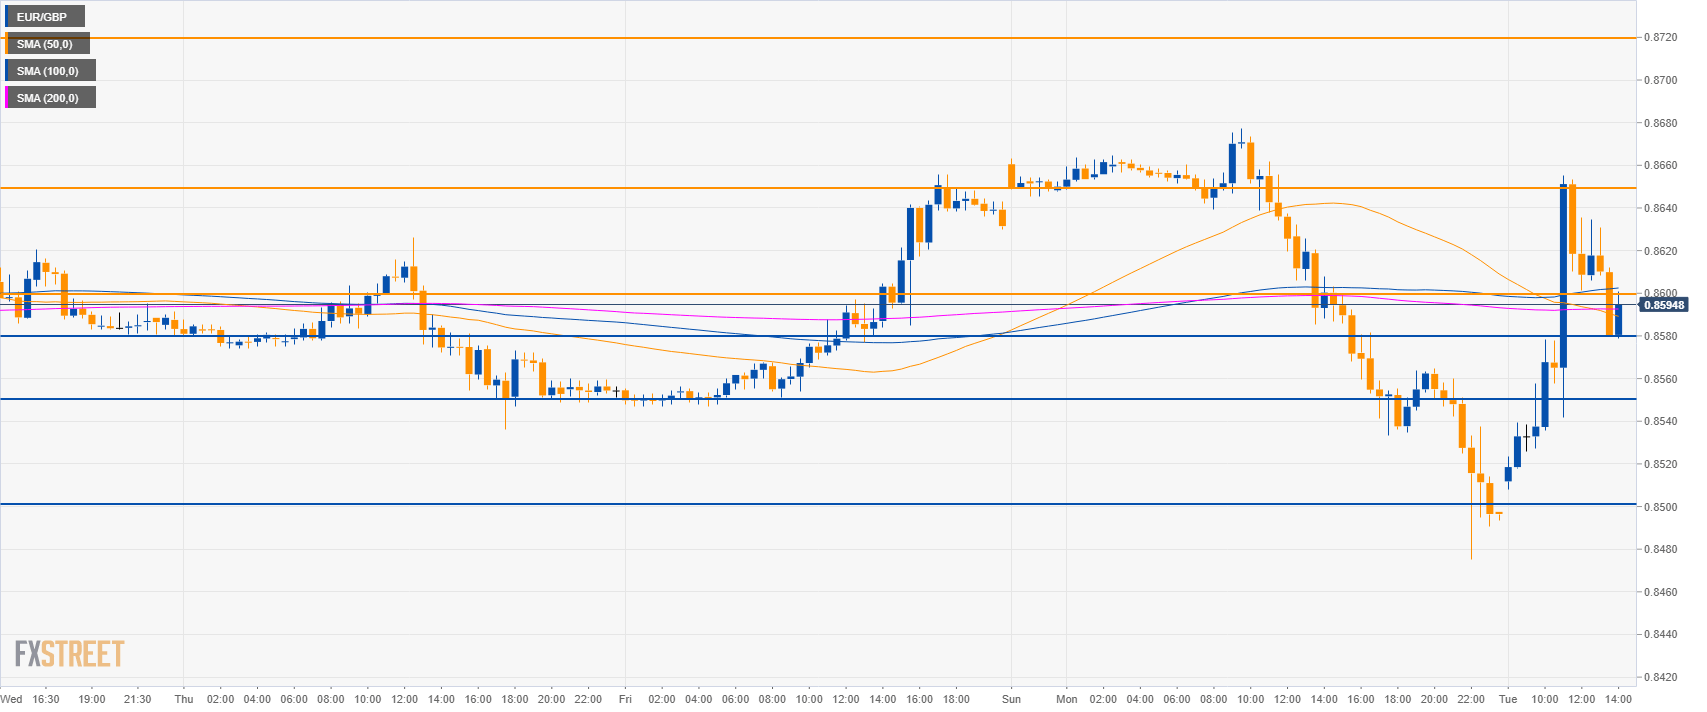
EUR/GBP 30-minute chart
- EUR/GBP is trading in a range near the 0.8600 level.
- A break below 0.8580 can lead to 0.8550 and 0.8500 level.
- Resistance is at 0.8650 and 0.8720 level.
Additional key levels
EUR/GBP
Overview:
Today Last Price: 0.858
Today Daily change: 29 pips
Today Daily change %: 0.34%
Today Daily Open: 0.8551
Trends:
Daily SMA20: 0.8658
Daily SMA50: 0.8764
Daily SMA100: 0.8829
Daily SMA200: 0.8854
Levels:
Previous Daily High: 0.8678
Previous Daily Low: 0.8533
Previous Weekly High: 0.8656
Previous Weekly Low: 0.8536
Previous Monthly High: 0.8842
Previous Monthly Low: 0.8529
Daily Fibonacci 38.2%: 0.8588
Daily Fibonacci 61.8%: 0.8622
Daily Pivot Point S1: 0.8497
Daily Pivot Point S2: 0.8443
Daily Pivot Point S3: 0.8353
Daily Pivot Point R1: 0.8641
Daily Pivot Point R2: 0.8731
Daily Pivot Point R3: 0.8785
