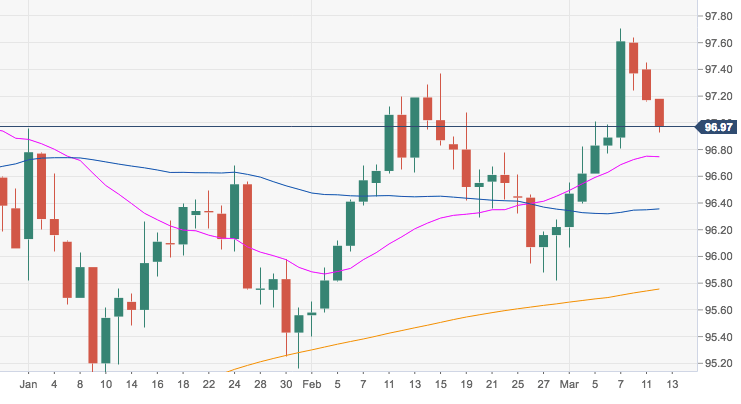
- The index keeps correcting lower following last week’s new 2019 highs in the 97.70/75 band and is currently challenging the cirtical support at 97.00 the figure.
- Extra losses are likely in the current scenario of risk-on trade and are expected to meet initial contention in the 96.80/70 band, where converge the 10-day and 21-day SMAs.
- In spite of the ongoing correction lower, the constructive outlook in DXY is seen unchanged above the critical 200-day SMA, today at 95.75.
DXY daily chart
Dollar Index Spot
Overview:
Today Last Price: 96.96
Today Daily change: 18 pips
Today Daily change %: -0.22%
Today Daily Open: 97.17
Trends:
Daily SMA20: 96.74
Daily SMA50: 96.32
Daily SMA100: 96.56
Daily SMA200: 95.74
Levels:
Previous Daily High: 97.45
Previous Daily Low: 97.16
Previous Weekly High: 97.71
Previous Weekly Low: 96.4
Previous Monthly High: 97.37
Previous Monthly Low: 95.4
Daily Fibonacci 38.2%: 97.27
Daily Fibonacci 61.8%: 97.34
Daily Pivot Point S1: 97.07
Daily Pivot Point S2: 96.97
Daily Pivot Point S3: 96.78
Daily Pivot Point R1: 97.36
Daily Pivot Point R2: 97.55
Daily Pivot Point R3: 97.65
