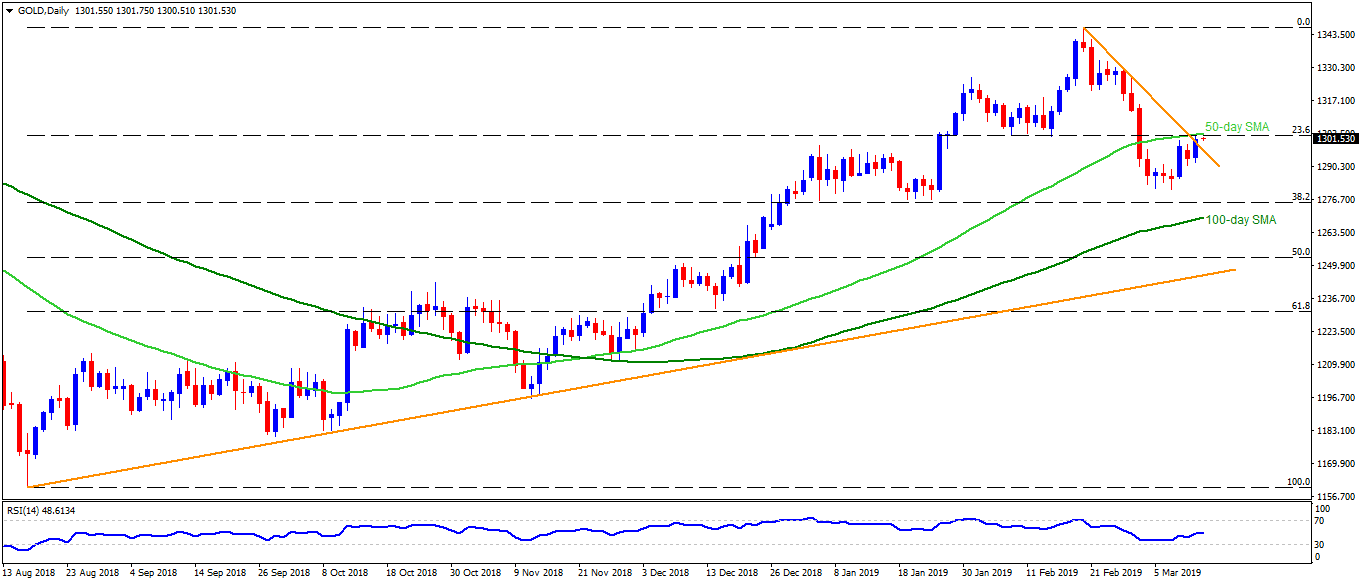
Gold daily chart
- Gold is on bid near $1301.50 during early Asian trading on Wednesday.
- 23.6% Fibonacci retracement of its August 2018 to February 2019 upside at $1303, followed by 50-day simple moving average (SMA) figure of $1303.50, can act as nearby resistance.
- A break of $1303.50 can escalate a recent recovery towards $1308 and $1313.
- Meanwhile, $1295, $1286 and $1280 may limit immediate downside ahead of highlighting 100-day SMA level at $1270.
- Should prices slid under $1270, 50% Fibonacci retracement near $1253.50 and an ascending trend-line estd. since mid-August could question bears’ strength near $1247.
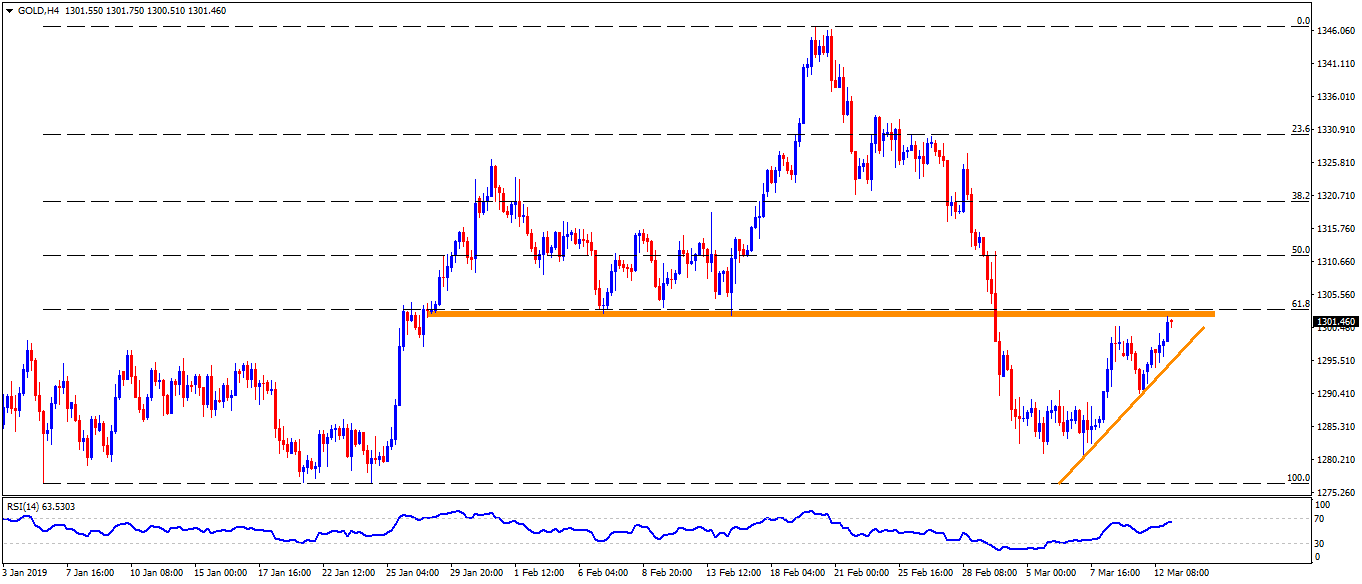
Gold 4-Hour chart
- On H4, $1302.50 – $1303 region including February lows may act as adjacent resistance before propelling the quote to $1303.50.
- Alternatively, $1290 can act as an intermediate halt between $1295 and $1286.
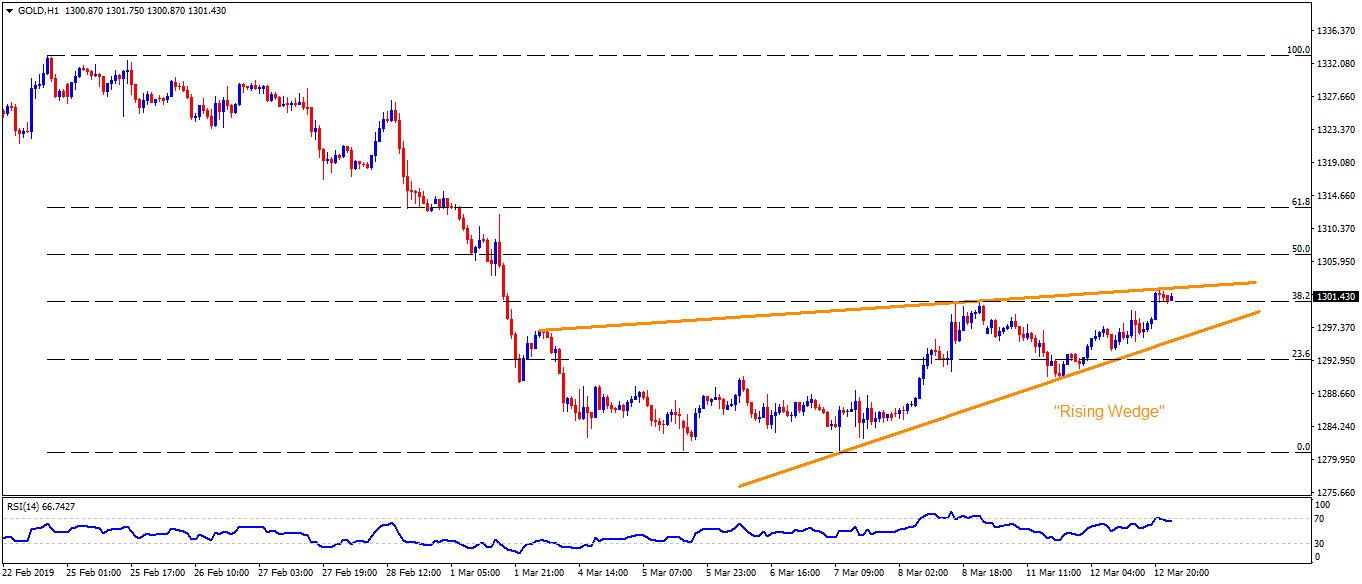
Gold hourly chart
- Short-term “rising wedge” resistance can confine nearby upside at $1302.
- Break of $1295 confirms the bearish formation targeting $1283.