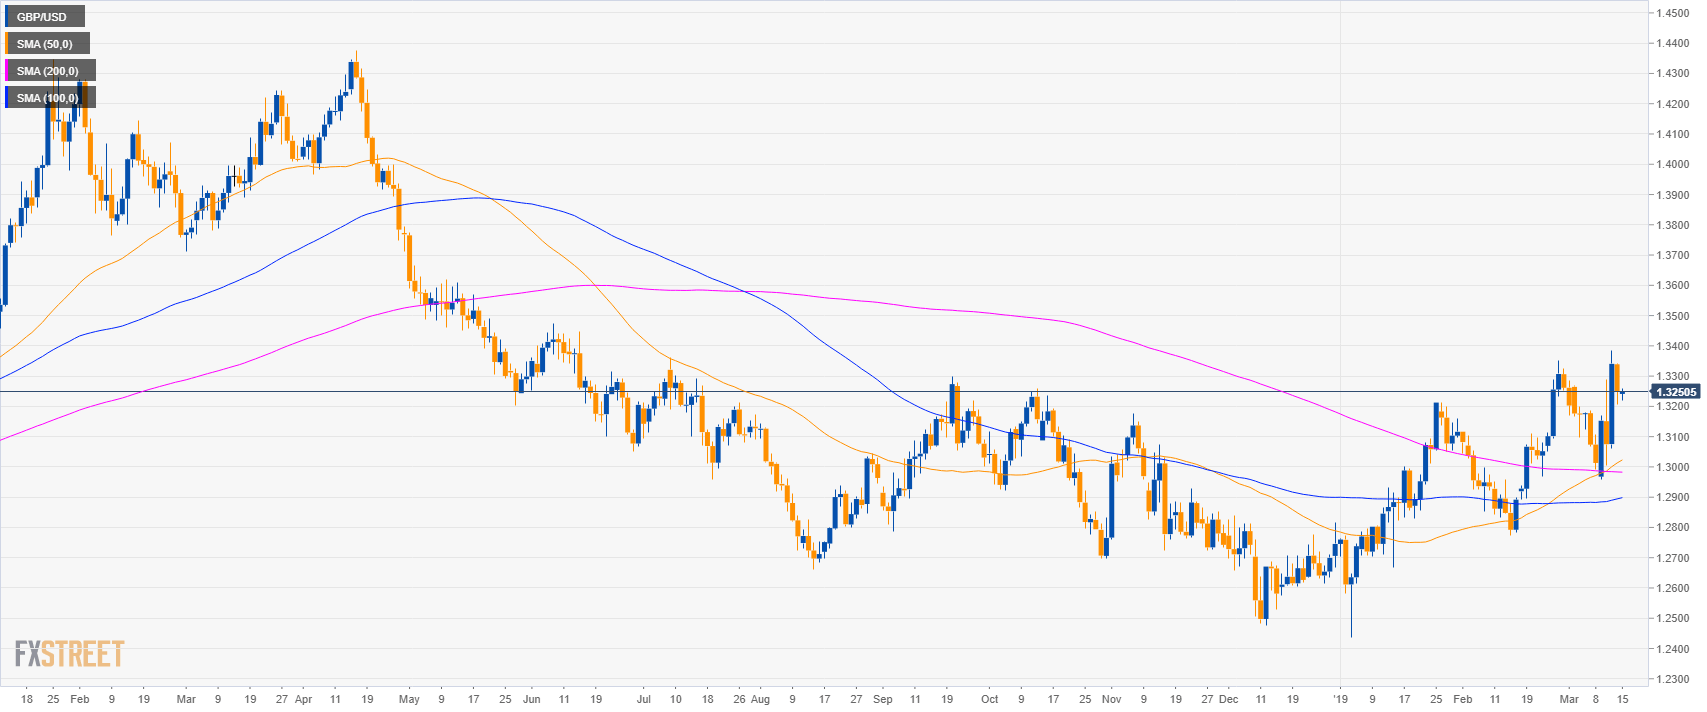
GBP/USD daily chart
- GBP/USD is trading in a bull trend above its main simple moving averages.
- The UK Parliament voted 412 to 202 to delay the Brexit.
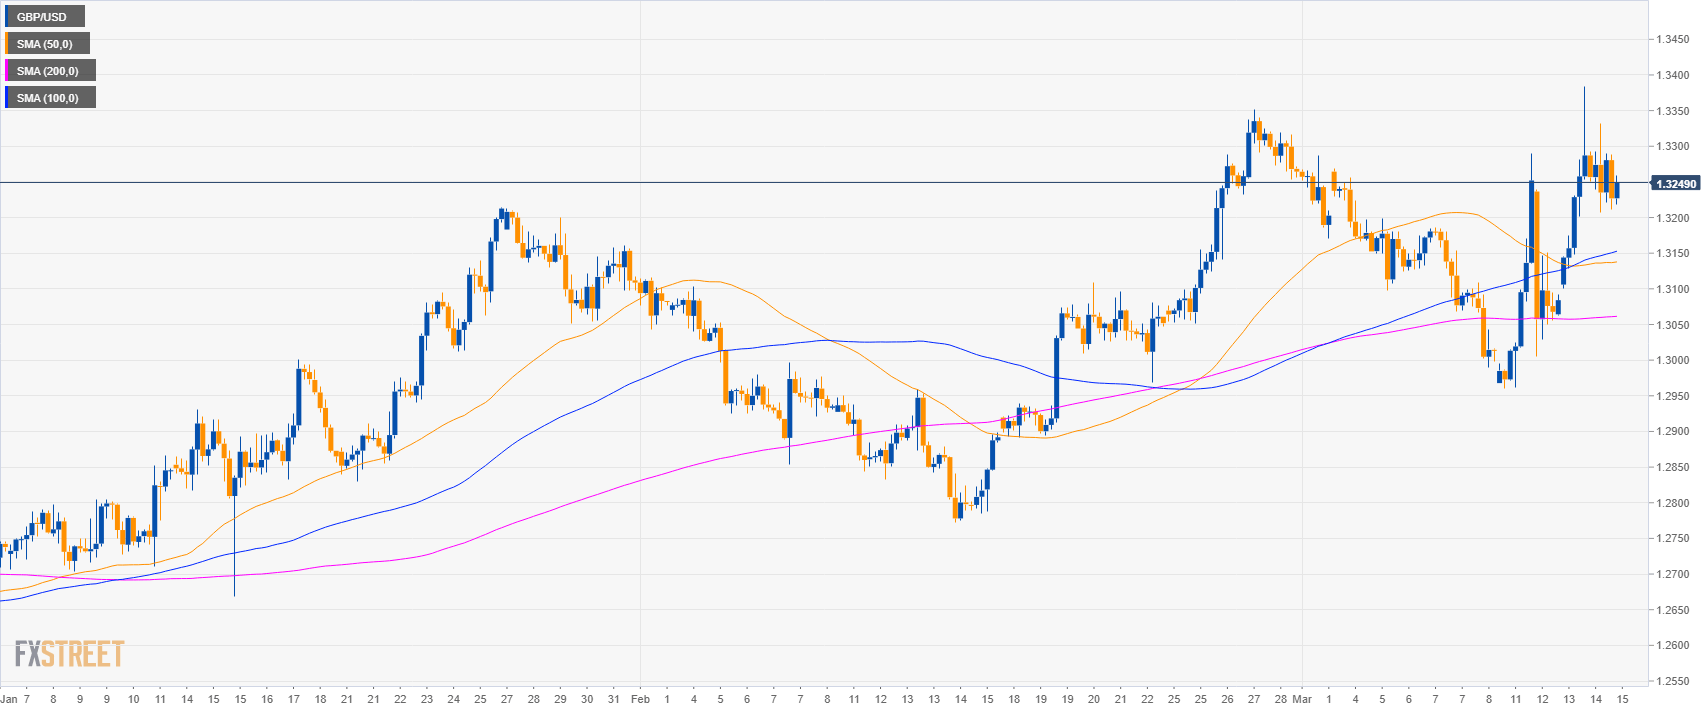
GBP/USD 4-hour chart
- GBP/USD is trading above its main SMAs suggesting a bullish bias in the medium-term.
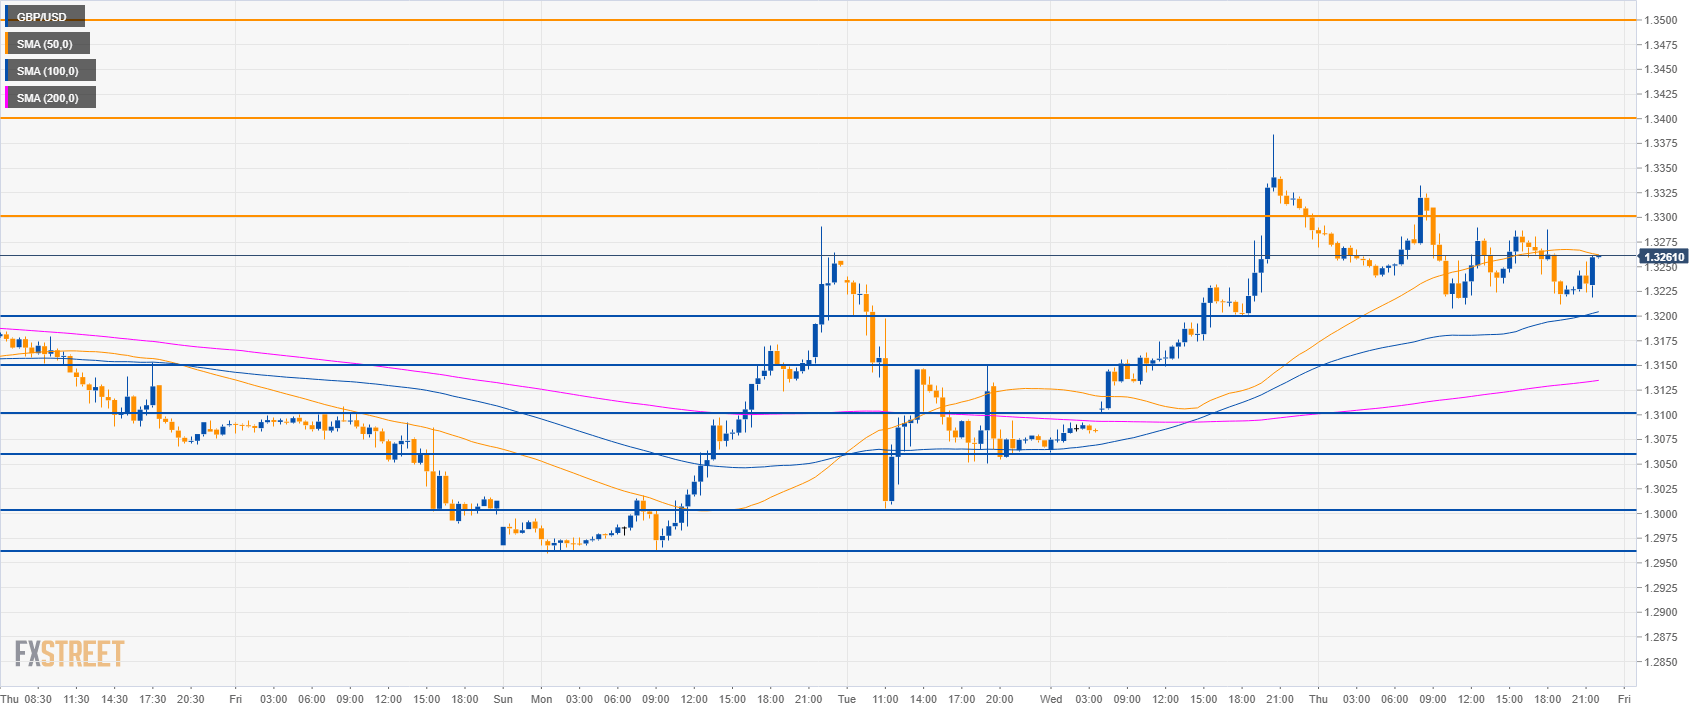
GBP/USD 30-minute chart
- GBP/USD is trading above its 100 and 200 SMAs suggesting bullish momentum in the short-term.
- Bulls are looking for a break above 1.3300 resistance which could lead to 1.3400 and 1.3500 figure.
- To the downside, support is at 1.3200 figure and 1.3150 level.
Additional key levels
GBP/USD
Overview:
Today Last Price: 1.3228
Today Daily change: -112 pips
Today Daily change %: -0.84%
Today Daily Open: 1.334
Trends:
Daily SMA20: 1.3107
Daily SMA50: 1.3001
Daily SMA100: 1.289
Daily SMA200: 1.2984
Levels:
Previous Daily High: 1.3384
Previous Daily Low: 1.306
Previous Weekly High: 1.3269
Previous Weekly Low: 1.299
Previous Monthly High: 1.3351
Previous Monthly Low: 1.2773
Daily Fibonacci 38.2%: 1.3261
Daily Fibonacci 61.8%: 1.3184
Daily Pivot Point S1: 1.3139
Daily Pivot Point S2: 1.2937
Daily Pivot Point S3: 1.2814
Daily Pivot Point R1: 1.3463
Daily Pivot Point R2: 1.3586
Daily Pivot Point R3: 1.3788
