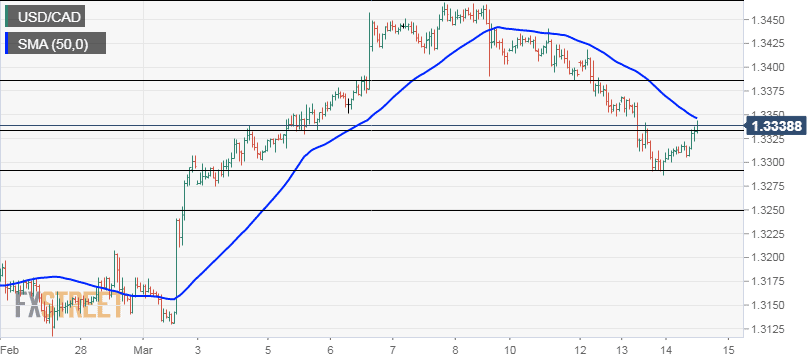
“¢ The pair stalled its recent sharp corrective slide and staged a solid bounce from 50% Fibonacci retracement level of the 1.3113-1.3469 up-move to snap four consecutive days of losing streak.
“¢ The intraday recovery move has now lifted the pair beyond 38.2% Fibonacci retracement level and closer to 50-hour SMA, which should act as an important pivotal point for intraday bullish traders.
“¢ Technical indicators on the daily chart remained in the bullish territory and have also started catching up with the positive momentum on the 1-hourly chart, supporting prospects for further intraday gains.
“¢ However, it would be prudent to wait for a follow-through move beyond the mentioned SMA before traders start positioning aggressively for an up-move towards 61.8% Fibonacci retracement level.
USD/CAD 1-hourly chart
USD/CAD
Overview:
Today Last Price: 1.3337
Today Daily change: 37 pips
Today Daily change %: 0.28%
Today Daily Open: 1.33
Trends:
Daily SMA20: 1.3276
Daily SMA50: 1.3267
Daily SMA100: 1.3297
Daily SMA200: 1.3183
Levels:
Previous Daily High: 1.337
Previous Daily Low: 1.329
Previous Weekly High: 1.3469
Previous Weekly Low: 1.3275
Previous Monthly High: 1.3341
Previous Monthly Low: 1.3069
Daily Fibonacci 38.2%: 1.3321
Daily Fibonacci 61.8%: 1.3339
Daily Pivot Point S1: 1.3271
Daily Pivot Point S2: 1.3241
Daily Pivot Point S3: 1.3192
Daily Pivot Point R1: 1.335
Daily Pivot Point R2: 1.3399
Daily Pivot Point R3: 1.3429
