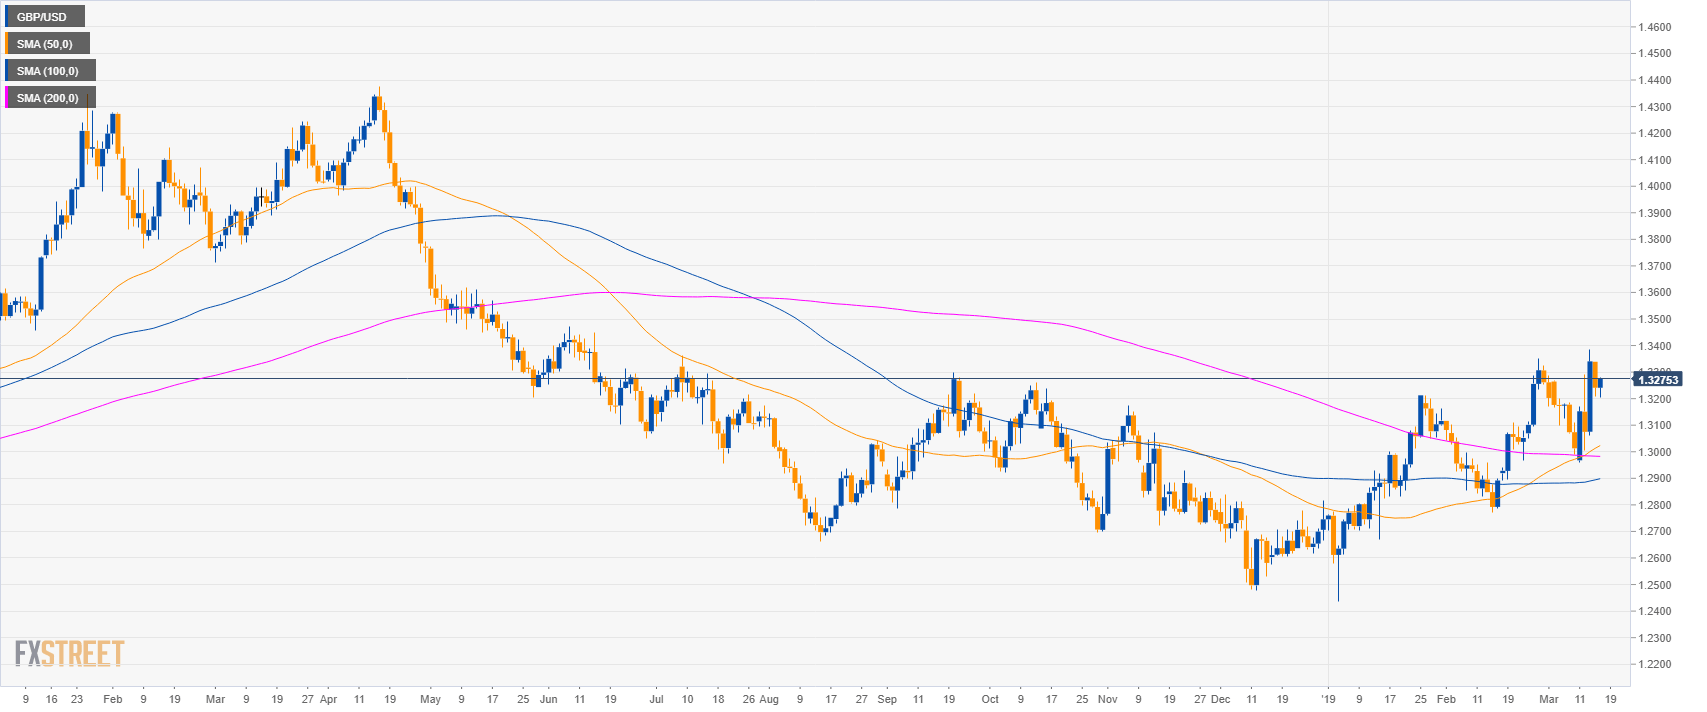
GBP/USD daily chart
- GBP/USD is trading in a bull trend above its main simple moving averages.
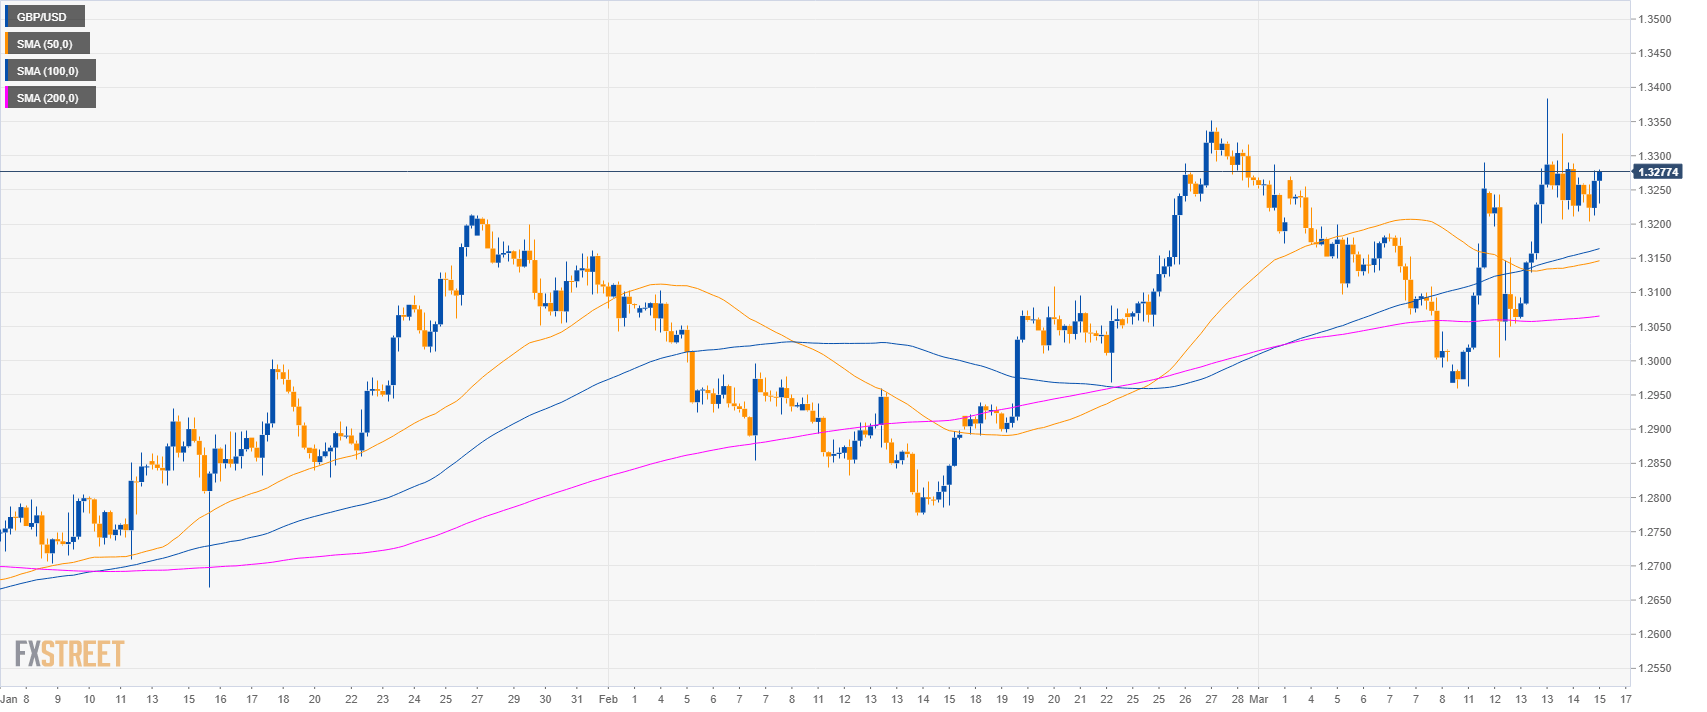
GBP/USD 4-hour chart
- GBP/USD is trading above its main SMAs suggesting a bullish bias in the medium-term.
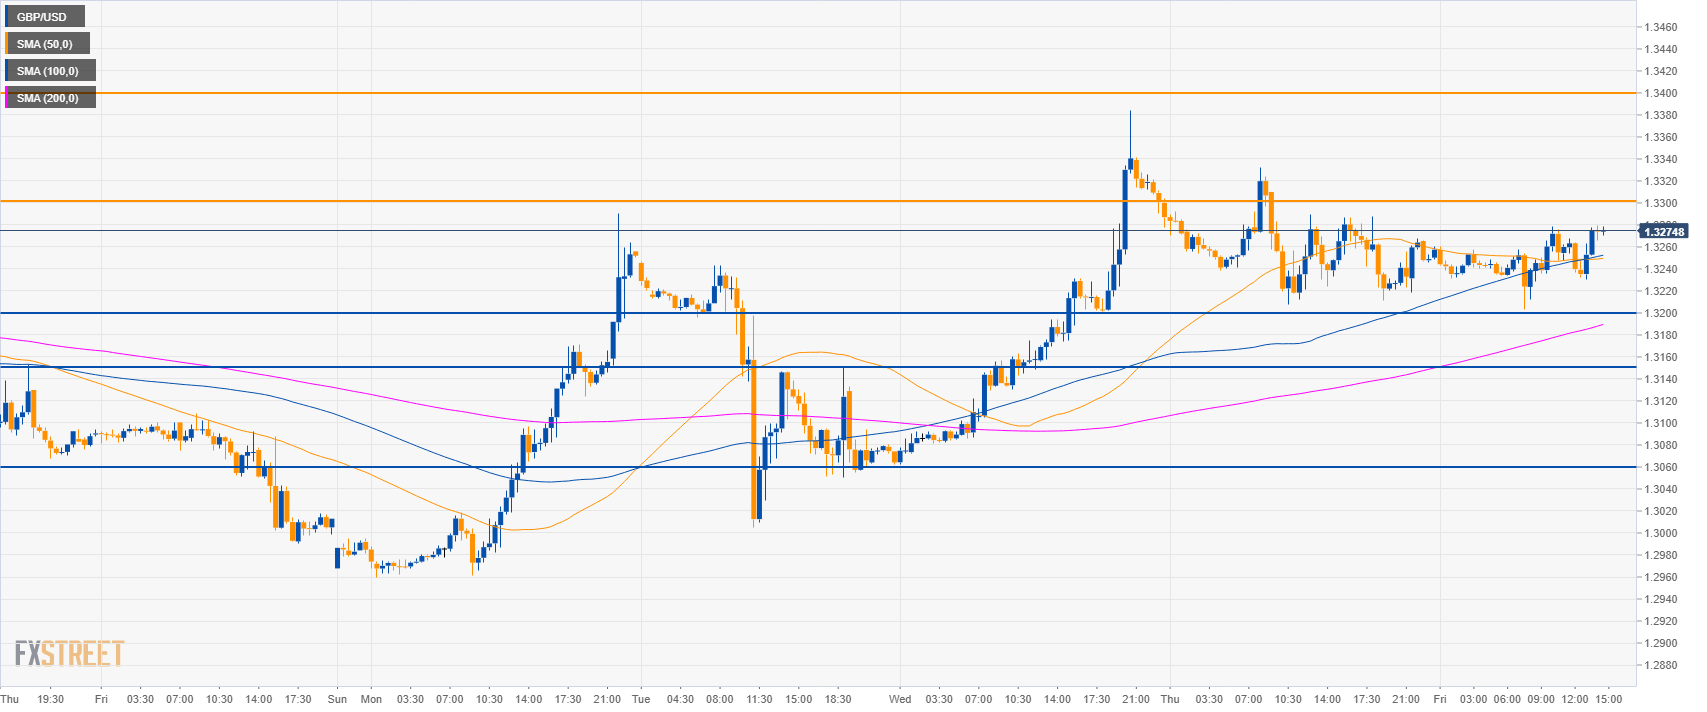
GBP/USD 30-minute chart
- GBP/USD is trading above its main SMAs suggesting bullish momentum in the short-term.
- Cable bulls are looking for a break beyond 1.3300 resistance which could lead to 1.3400 and 1.3500 figure.
- To the downside, support is at 1.3200 figure and 1.3150 level.
Additional key levels
GBP/USD
Overview:
Today Last Price: 1.3274
Today Daily change: 33 pips
Today Daily change %: 0.25%
Today Daily Open: 1.3241
Trends:
Daily SMA20: 1.3129
Daily SMA50: 1.3013
Daily SMA100: 1.2894
Daily SMA200: 1.2983
Levels:
Previous Daily High: 1.3342
Previous Daily Low: 1.3207
Previous Weekly High: 1.3269
Previous Weekly Low: 1.299
Previous Monthly High: 1.3351
Previous Monthly Low: 1.2773
Daily Fibonacci 38.2%: 1.3259
Daily Fibonacci 61.8%: 1.329
Daily Pivot Point S1: 1.3185
Daily Pivot Point S2: 1.3129
Daily Pivot Point S3: 1.3051
Daily Pivot Point R1: 1.3319
Daily Pivot Point R2: 1.3397
Daily Pivot Point R3: 1.3453
