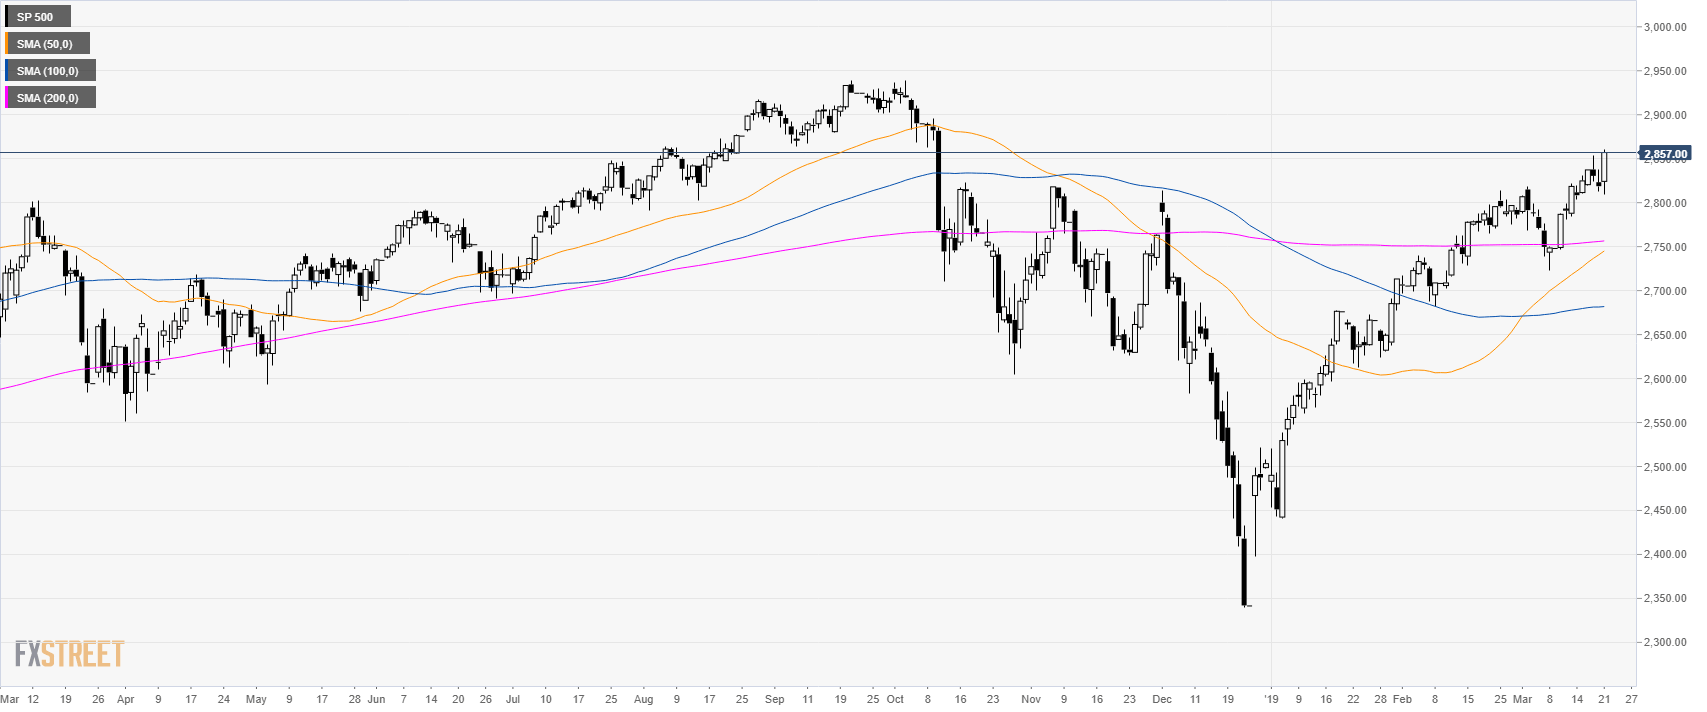
S&P500 daily chart
- The S&P500 is trading above its main simple moving average suggesting bullish momentum.
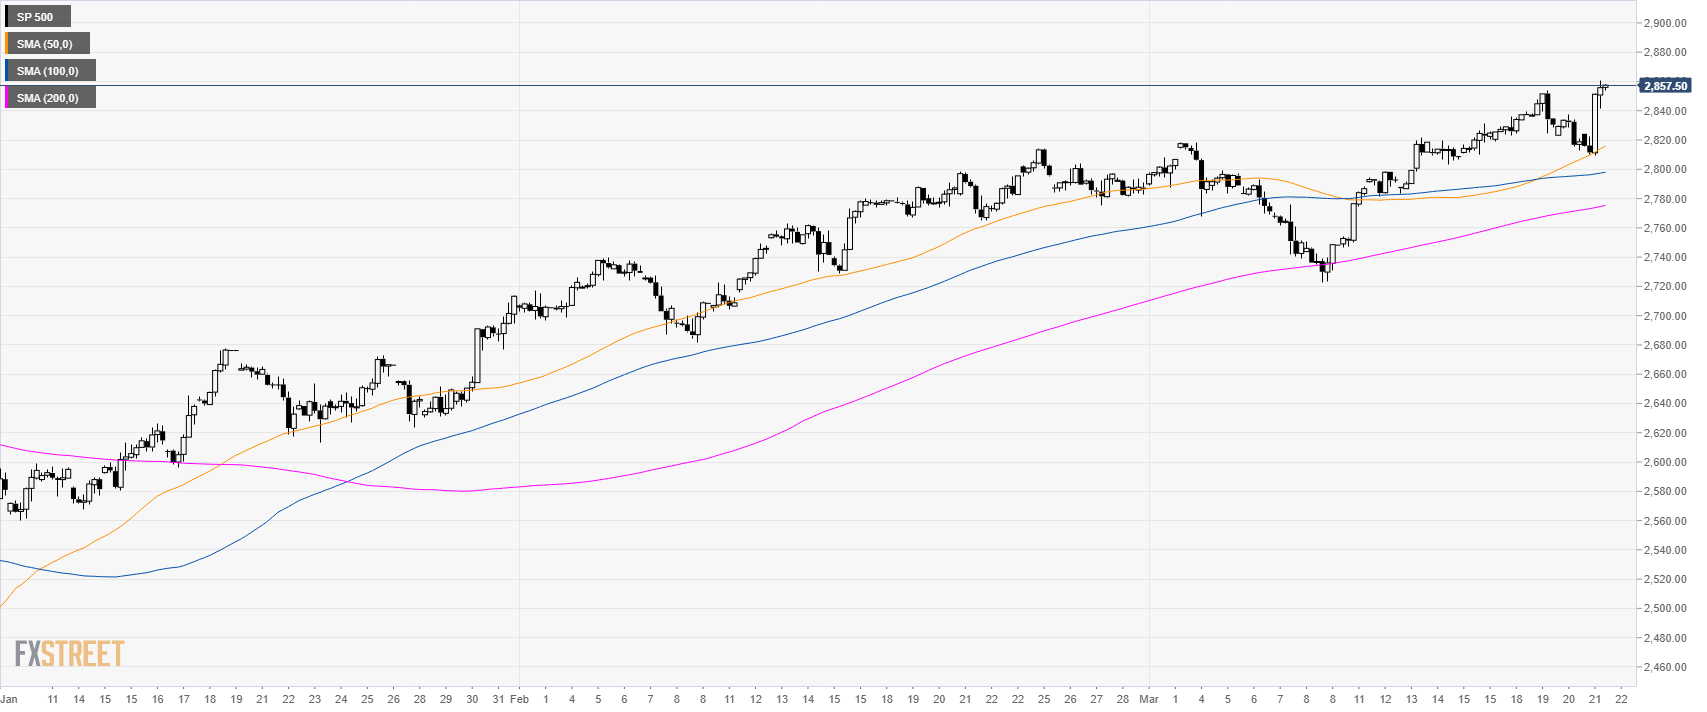
S&P500 4-hour chart
- The S&P500 is trading above its main SMAs suggesting bullish momentum in the medium-term.
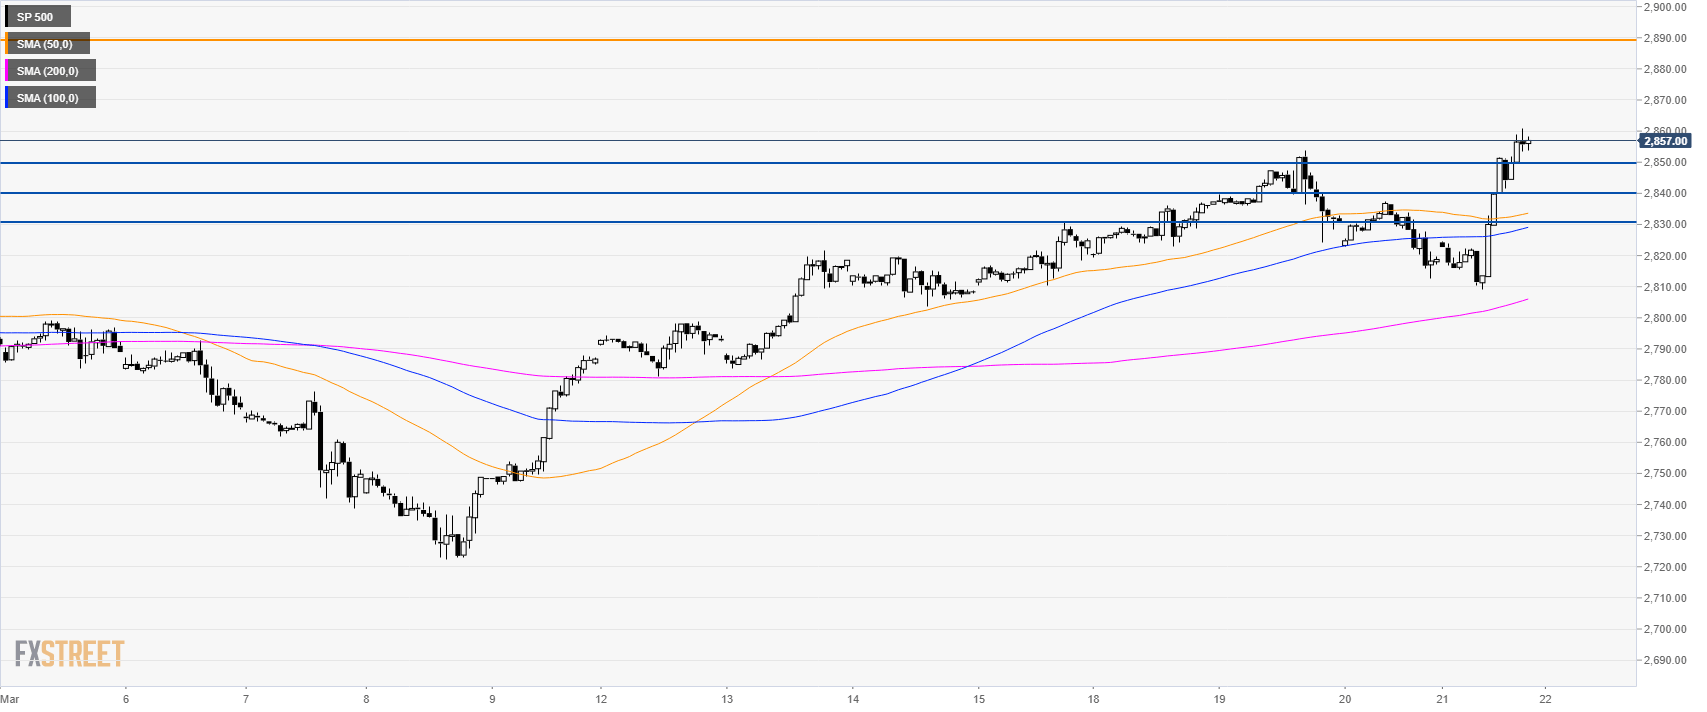
S&P500 60-minute chart
- The S&P500 is trading above its main SMAs suggesting bullish momentum in the short-term.
- The break above 2,850.00 resistance is opening the gates to the 2,890.00 level.
- Support is at 2,850.00 and 2,840.00 level
Additional key levels
