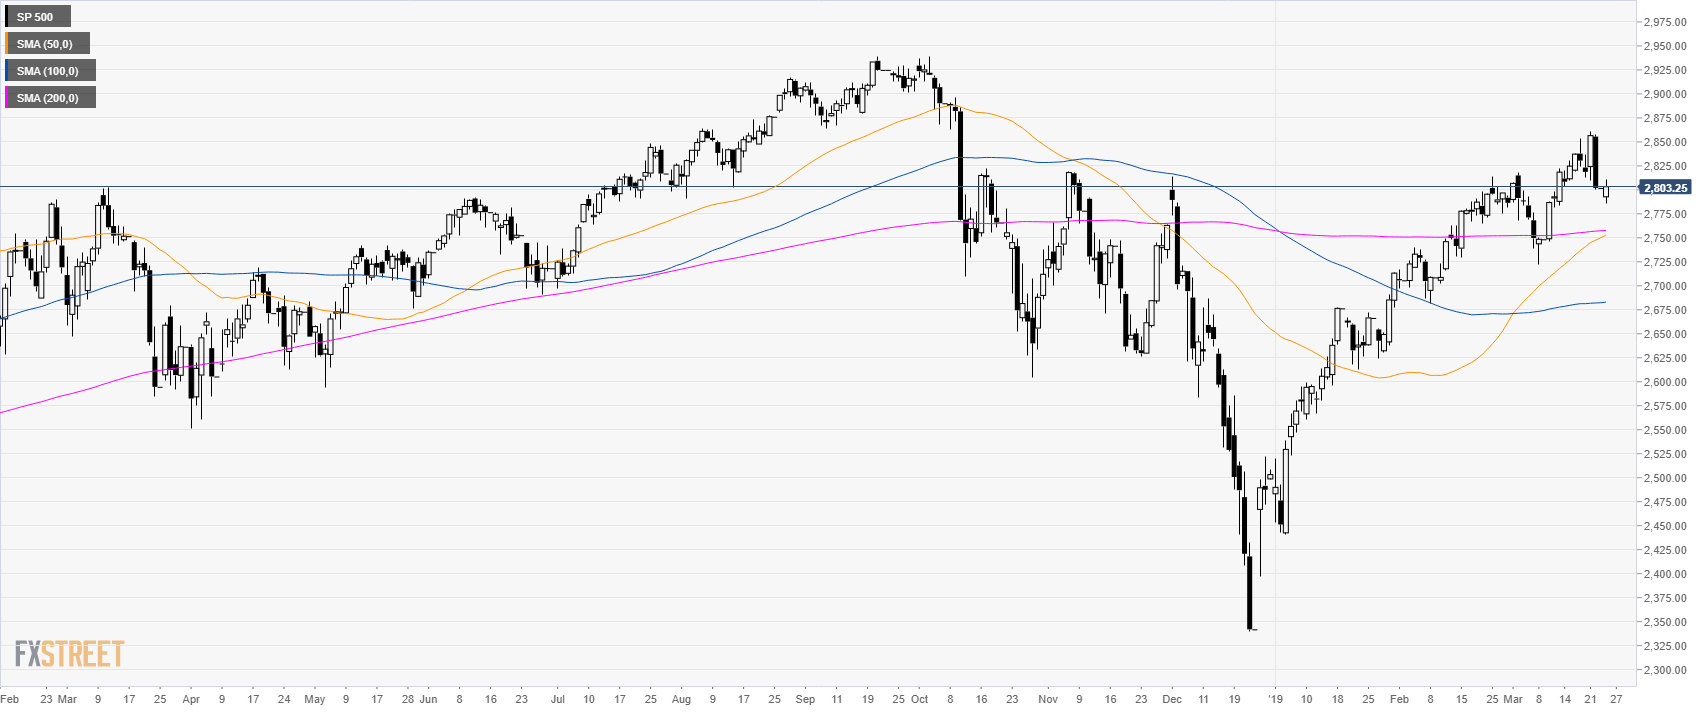
S&P500 daily chart
- The S&P500 is trading above its main simple moving average suggesting bullish momentum.
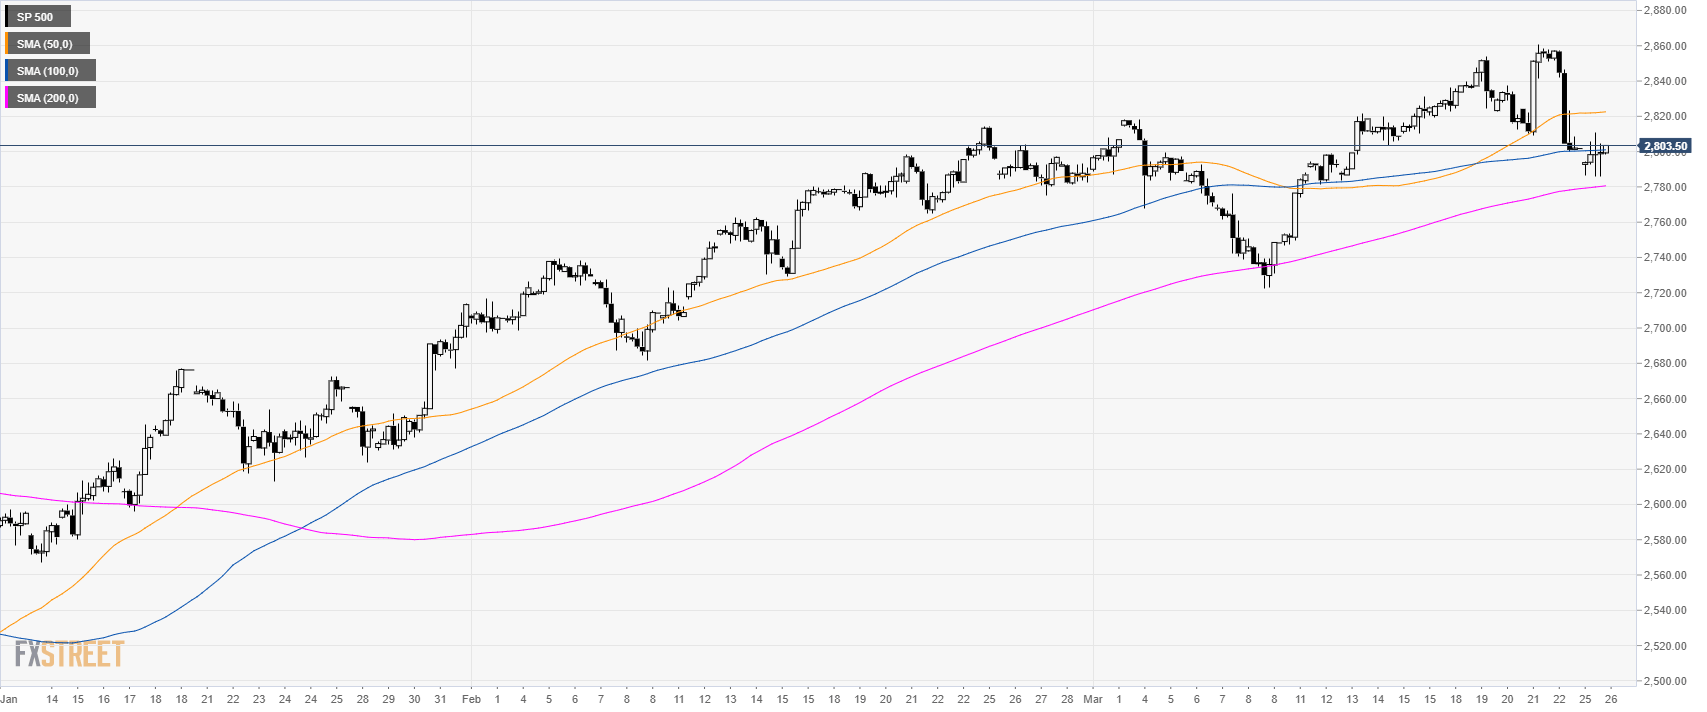
S&P500 4-hour chart
- The S&P500 is trading above the 100 and 200 SMAs suggesting a bullish bias in the medium-term.
S&P500 60-minute chart
- The S&P500 found some support at the 2,790.00 level.
- To the upside, resistance is at 2,820.00, 2,830.00 level and 2,840.00 level.
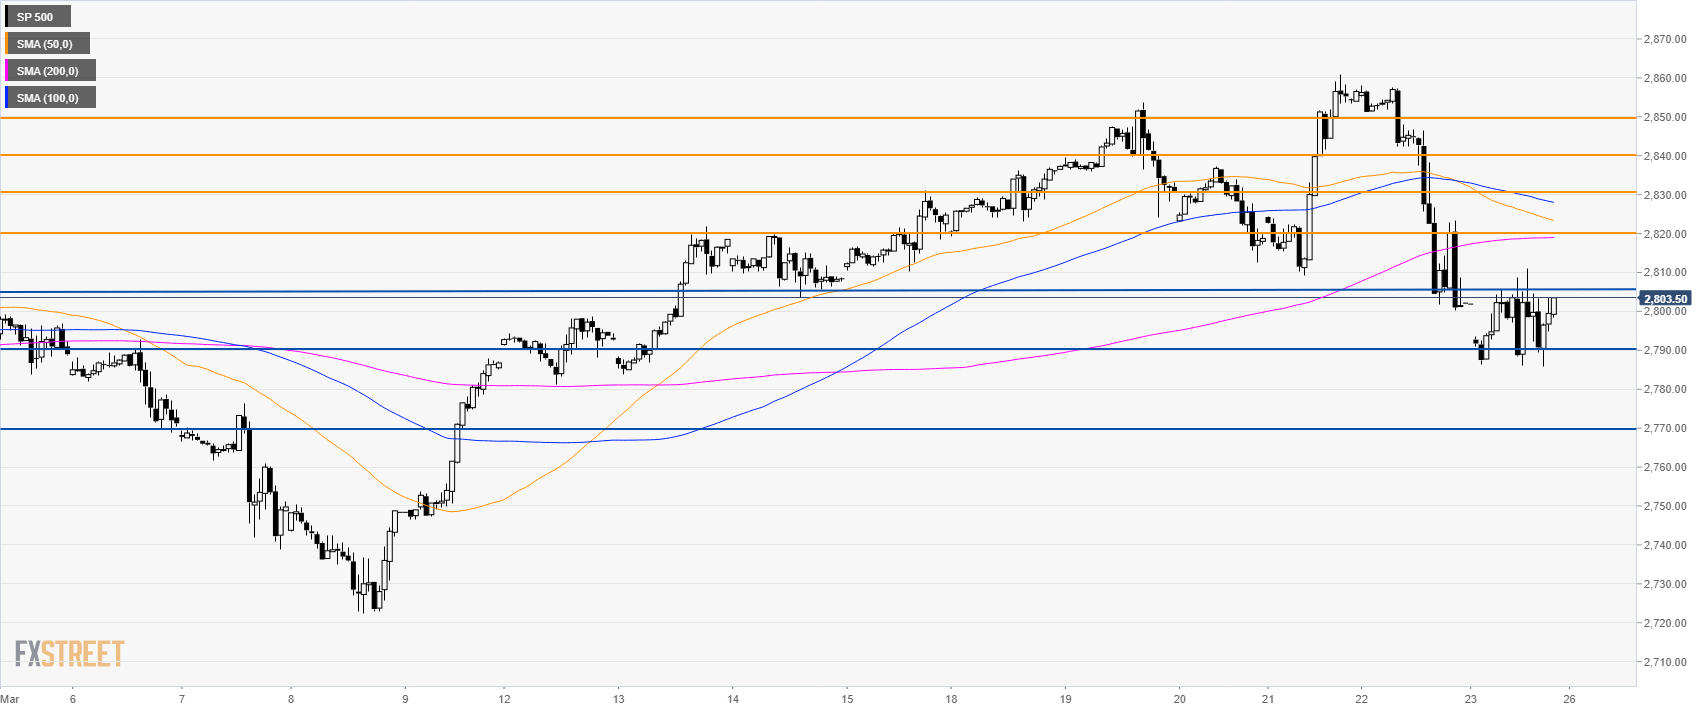
Additional key levels
