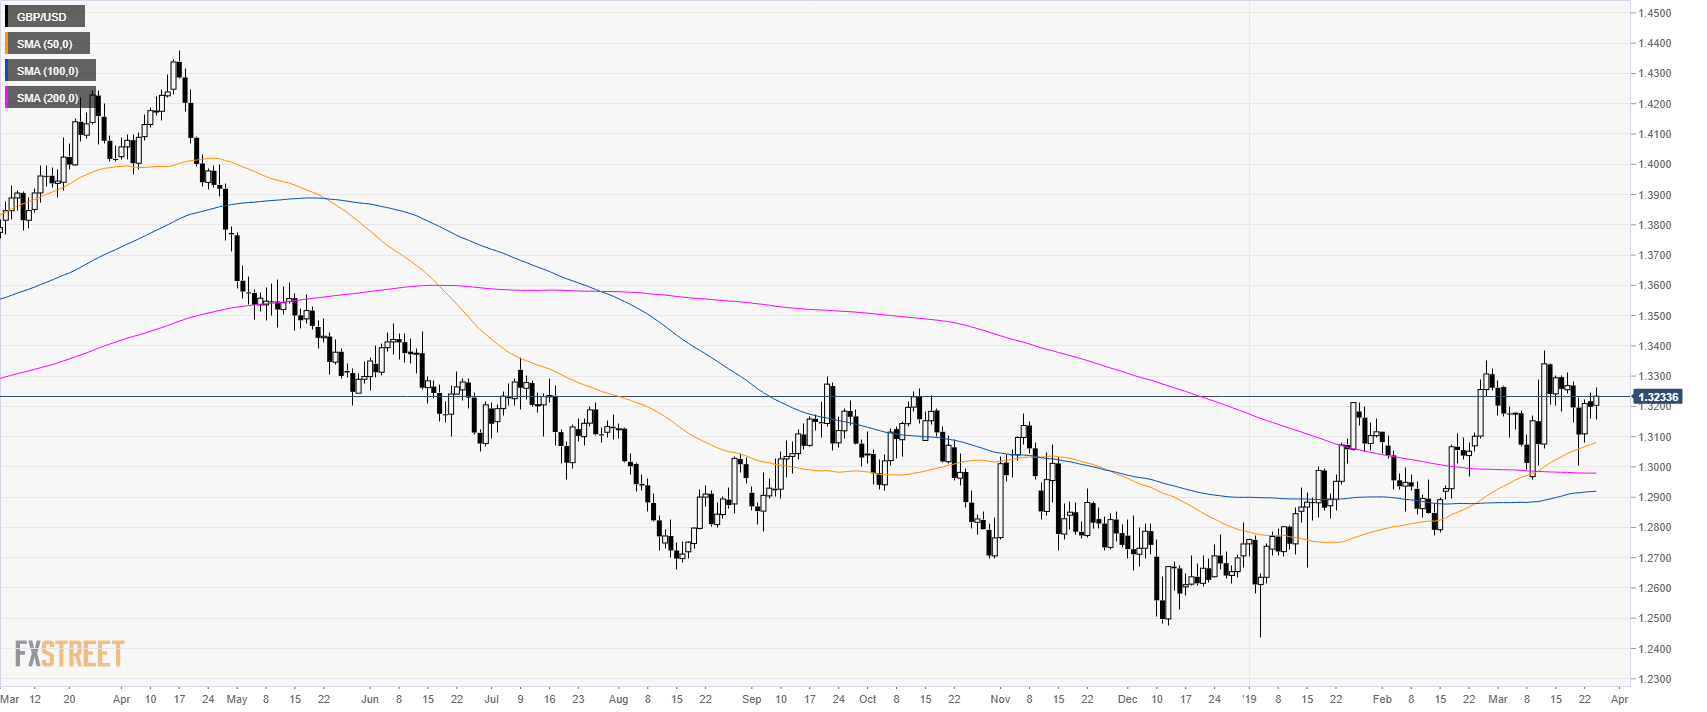
GBP/USD daily chart
- GBP/USD is trading in a bull trend above its main simple moving averages (SMAs).
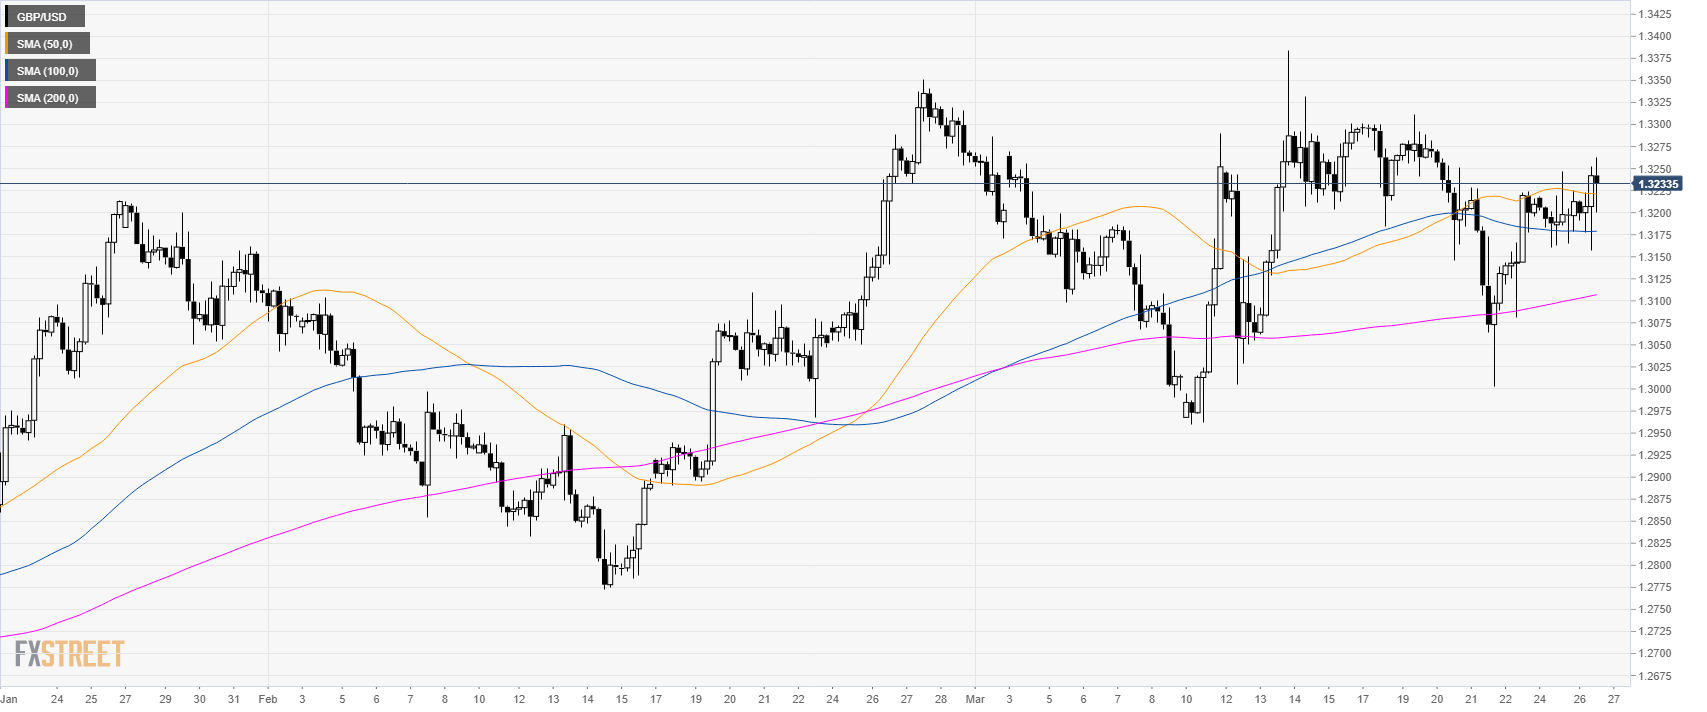
GBP/USD 4-hour chart
- GBP/USD is trading above its main SMAs suggesting a bullish momentum in the medium-term.
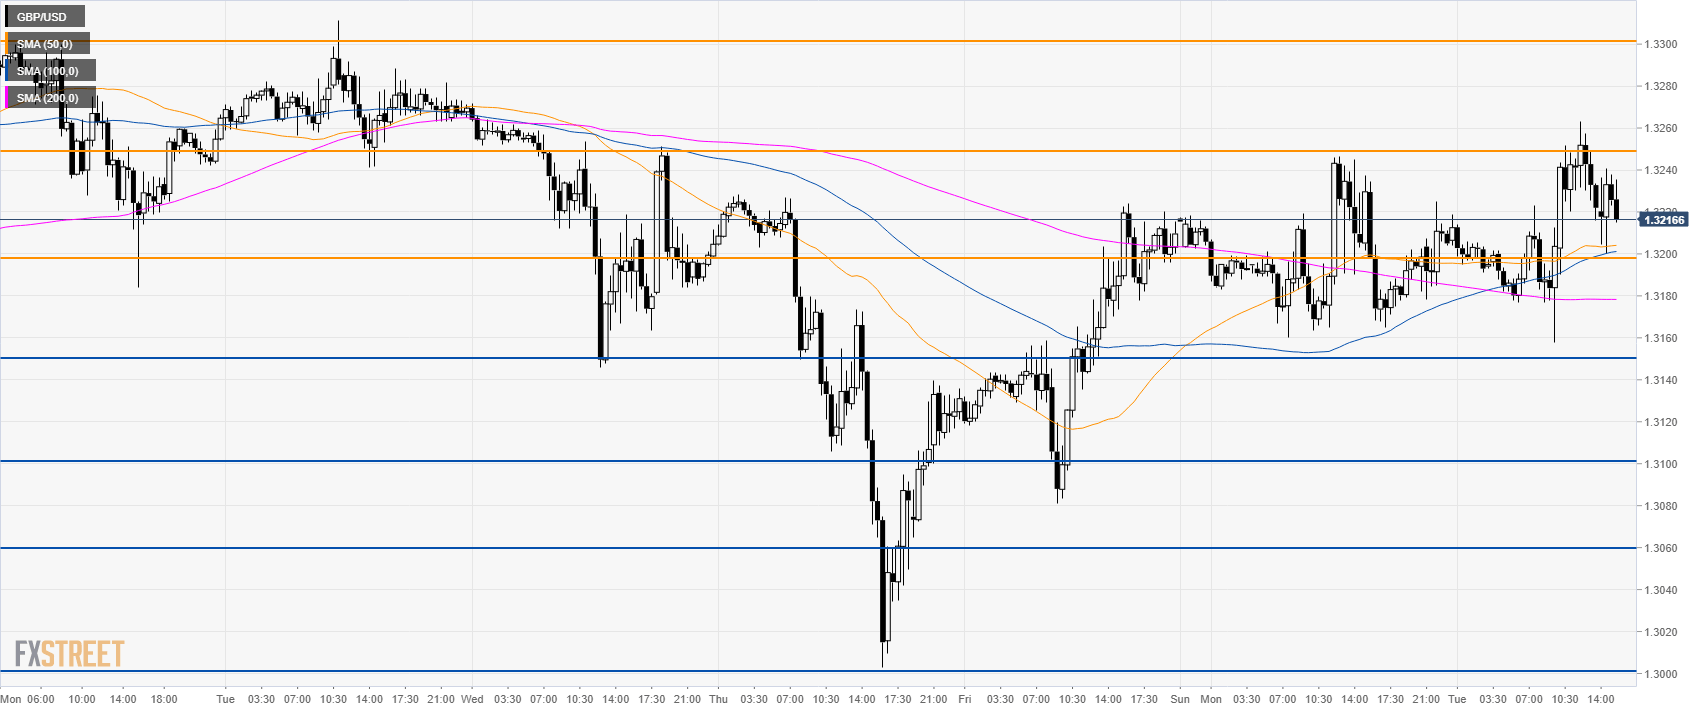
GBP/USD 30-minute chart
- GBP/USD is trading below the 1.3200 figure and its main SMAs suggesting bullish momentum in the short-term.
- The level to beat for bulls is 1.3250 followed by 1.3300 the figure.
- To the downside, support is at 1.3200 figure and 1.3150 level.
Additional key levels
