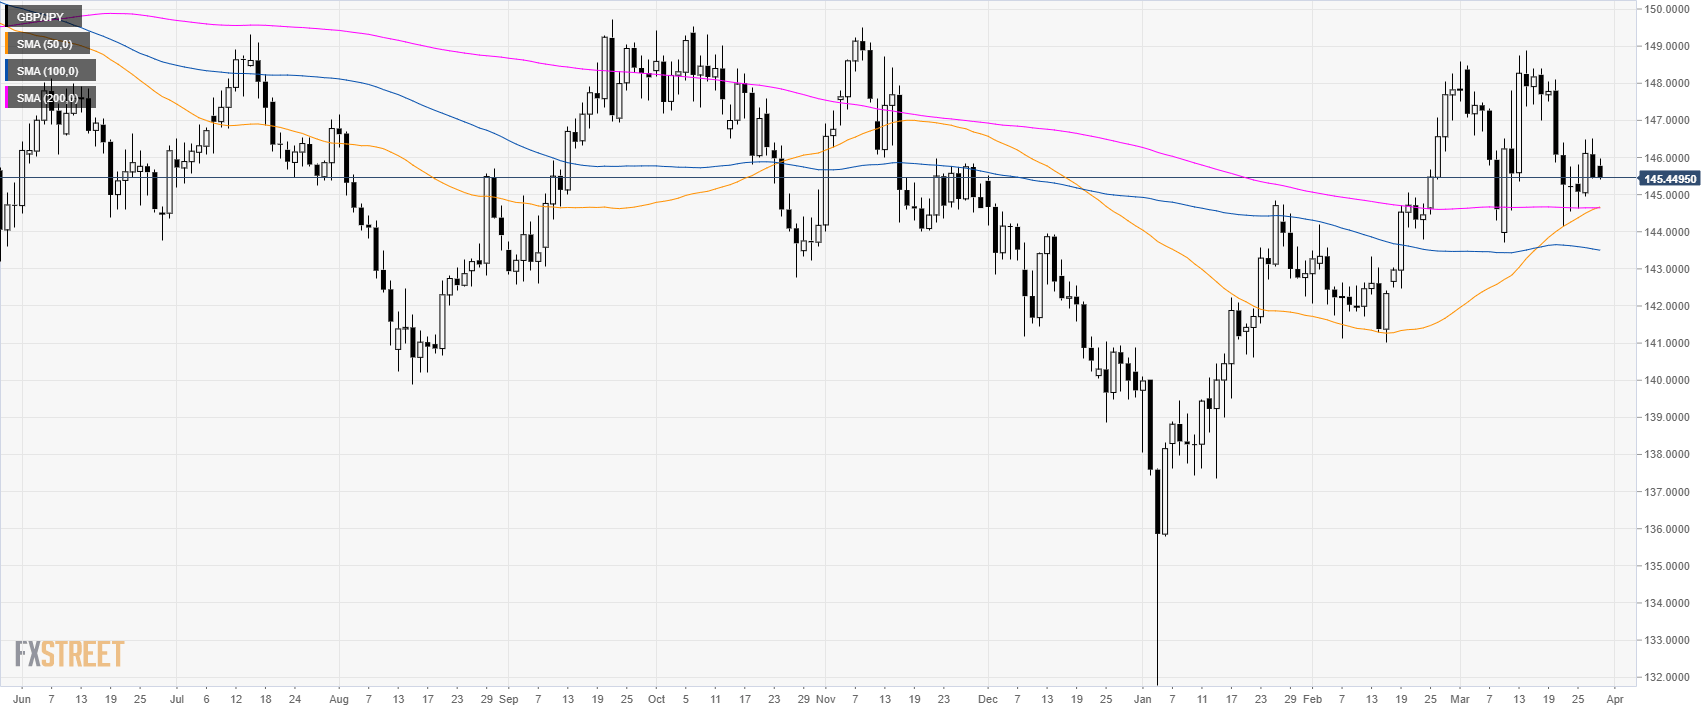
GBP/JPY daily chart
- GBP/JPY is trading in a bull trend above its main simple moving averages (SMAs).
- Sterling is losing in value across the board as the DUP (Democratic Unionist Party) is not supporting the Brexit deal.
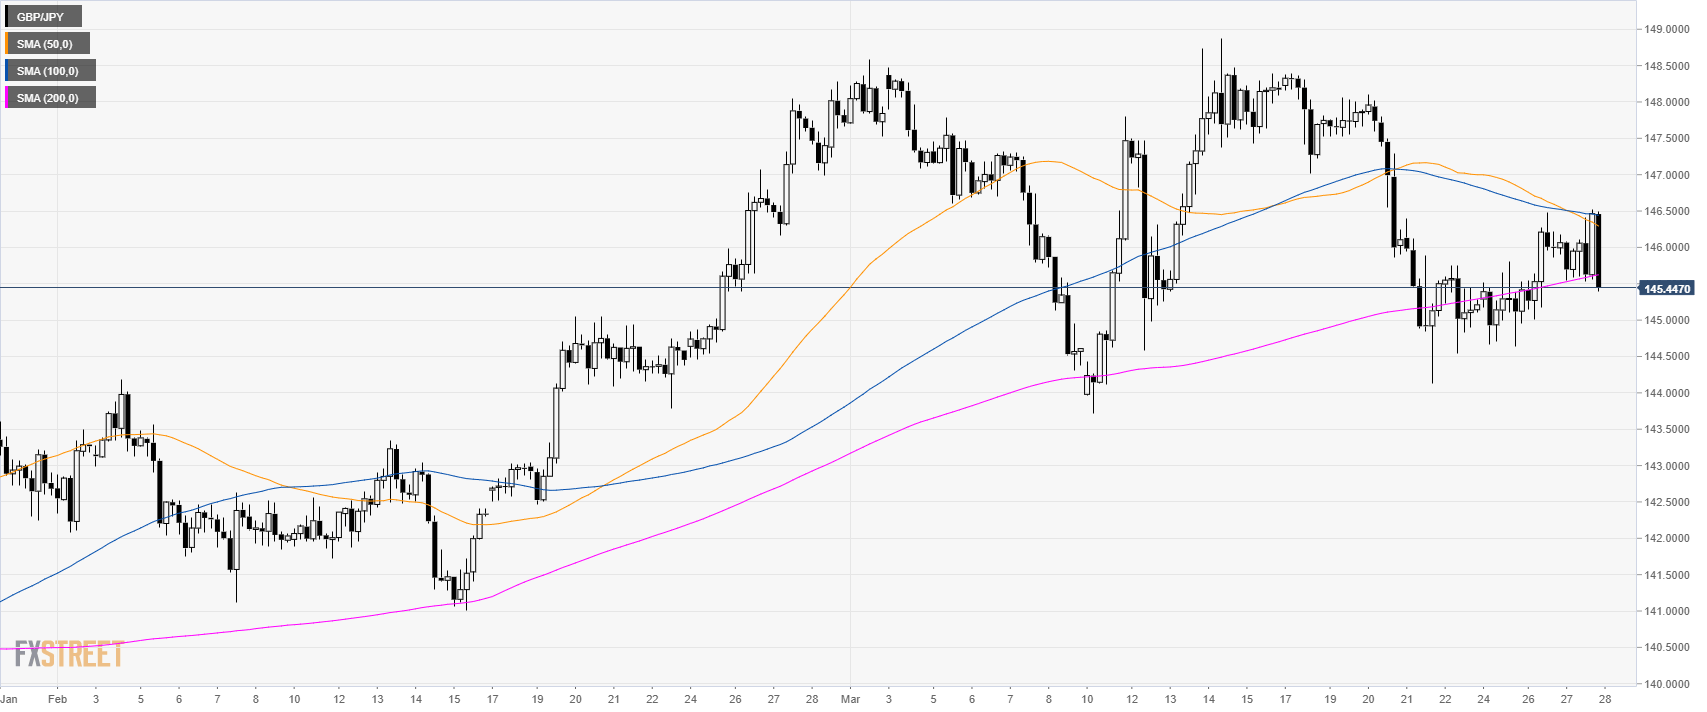
GBP/JPY 4-hour chart
- GBP/JPY is trading below its 200 SMA suggesting a bearish bias in the medium-term.
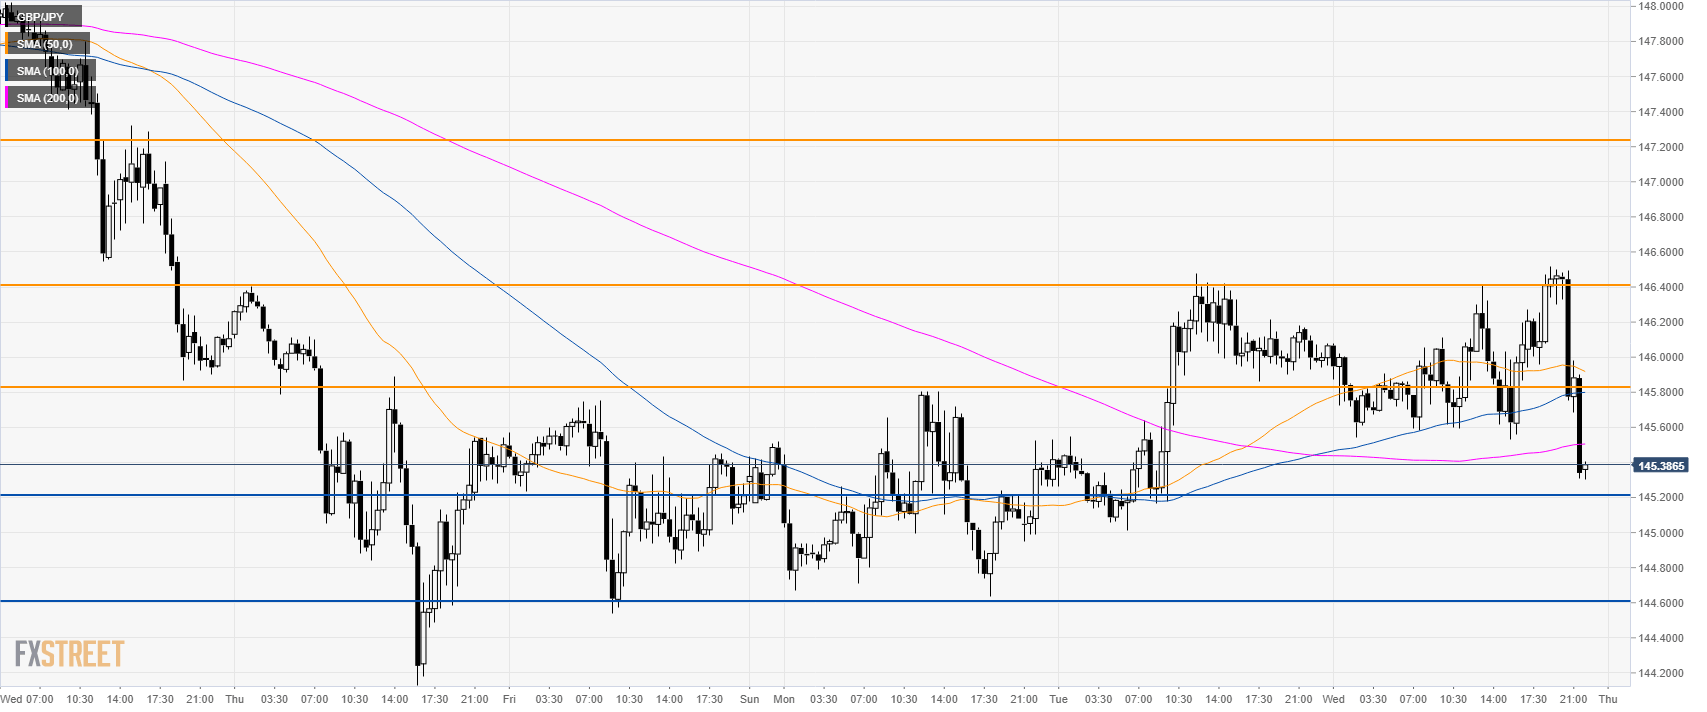
GBP/JPY 30-minute chart
- GBP/JPY is trading below its main SMAs suggesting a bearish bias in the short-term.
- A bear breakout below 145.20 should see 144.60 revisited.
- To the upside, resistance is at 145.80 and 146.40 level.
Additional key levels
