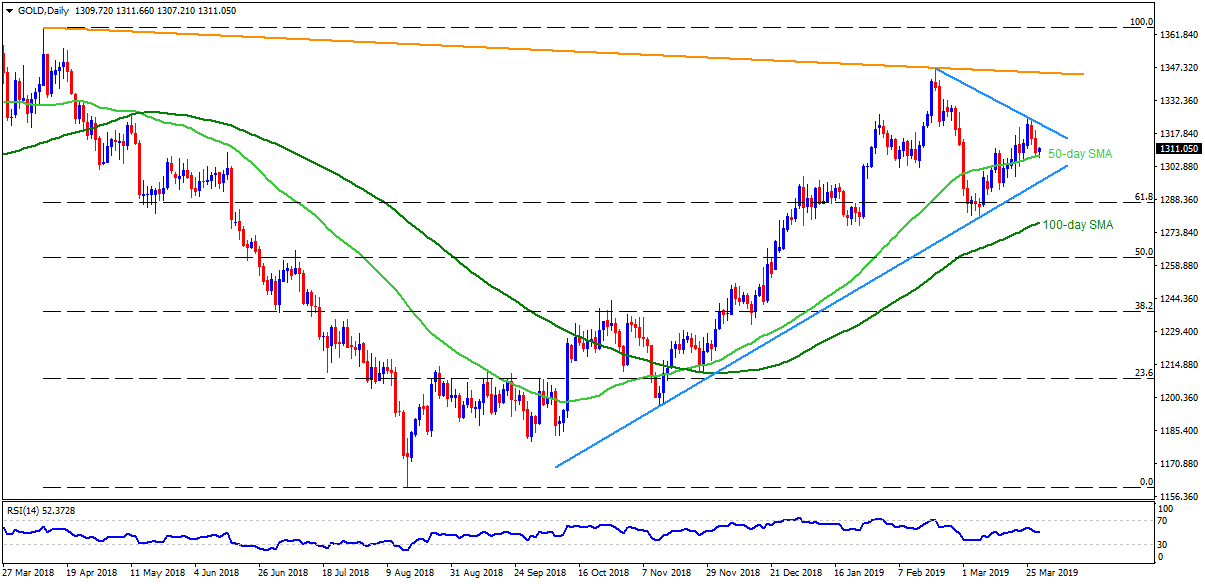
Gold daily chart
- Gold trades near $1311 ahead of European markets open on Thursday.
- The yellow metal recently bounced off the 50-day simple moving average (SMA) level around $1307.50, which in turn highlights the importance of $1317 and a descending trend-line stretched since February 20 at $1323.
- Given the prices manage to rally past-$1323, $1328 and $1333 may entertain buyers ahead of challenging them with nearly a year-old resistance-line at $1346.
- Meanwhile, a downside break of $1307.50 can recall $1300 on the chart but an upward sloping support-line stretched since November 2018 could confine further declines near $1296.
- In a case where the quote slips beneath $1296, 61.8% Fibonacci retracement of April to August 2018 downturn may offer intermediate halt around $1287 ahead of flashing 100-day SMA level of $1278 on bears’ radar.
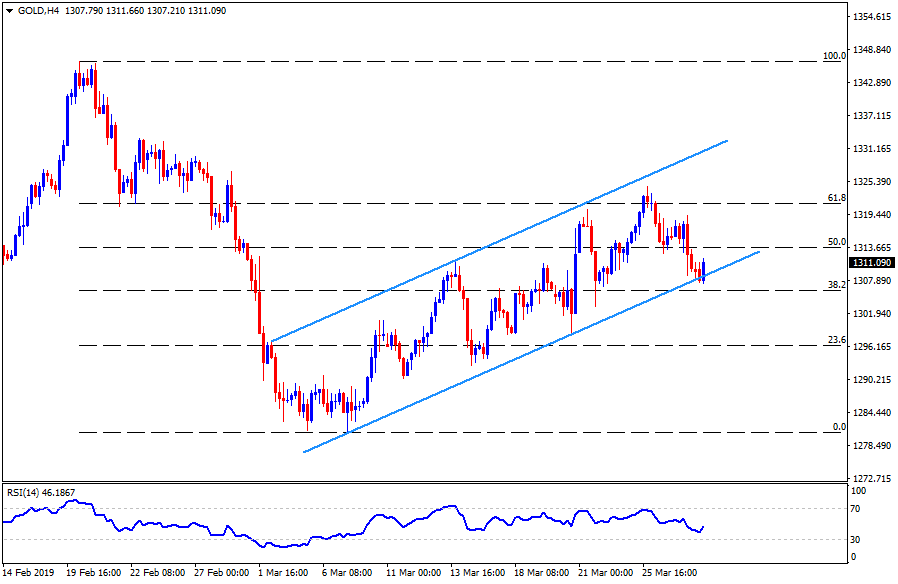
Gold 4-Hour chart
- In addition to the 50-day SMA on the daily chart, support-line of a short-term ascending trend-line also highlights the $1307/08 area as a crucial support-zone.
- Herein, $1321, $1325 and $1331 are likely additional resistances to watch.
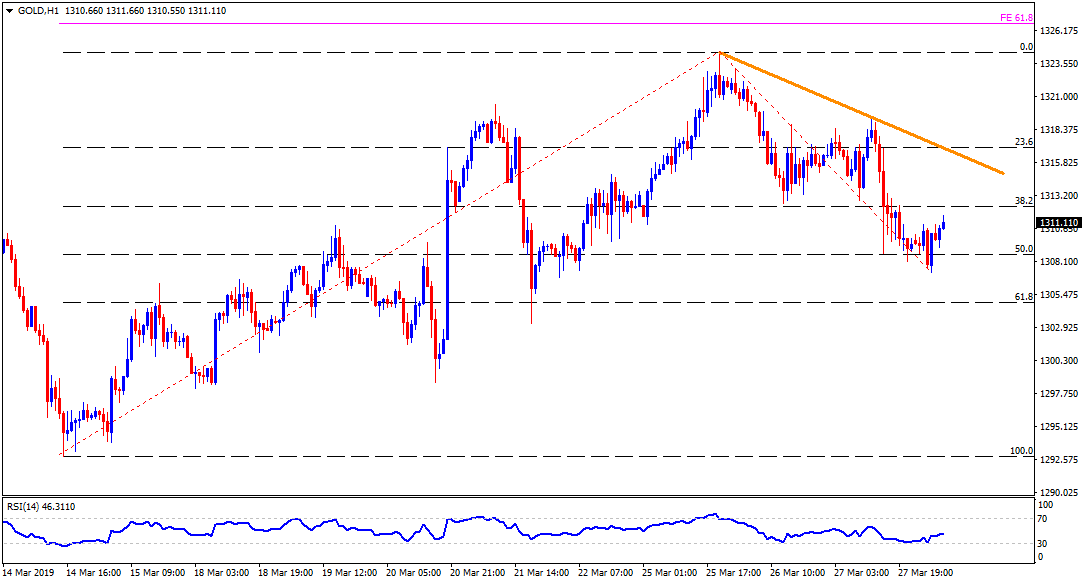
Gold hourly chart
- Lows of March 18 and 20 can provide extra support to the bullion near $1299.
- Wednesday’s high near $1320 seems the closest resistance.