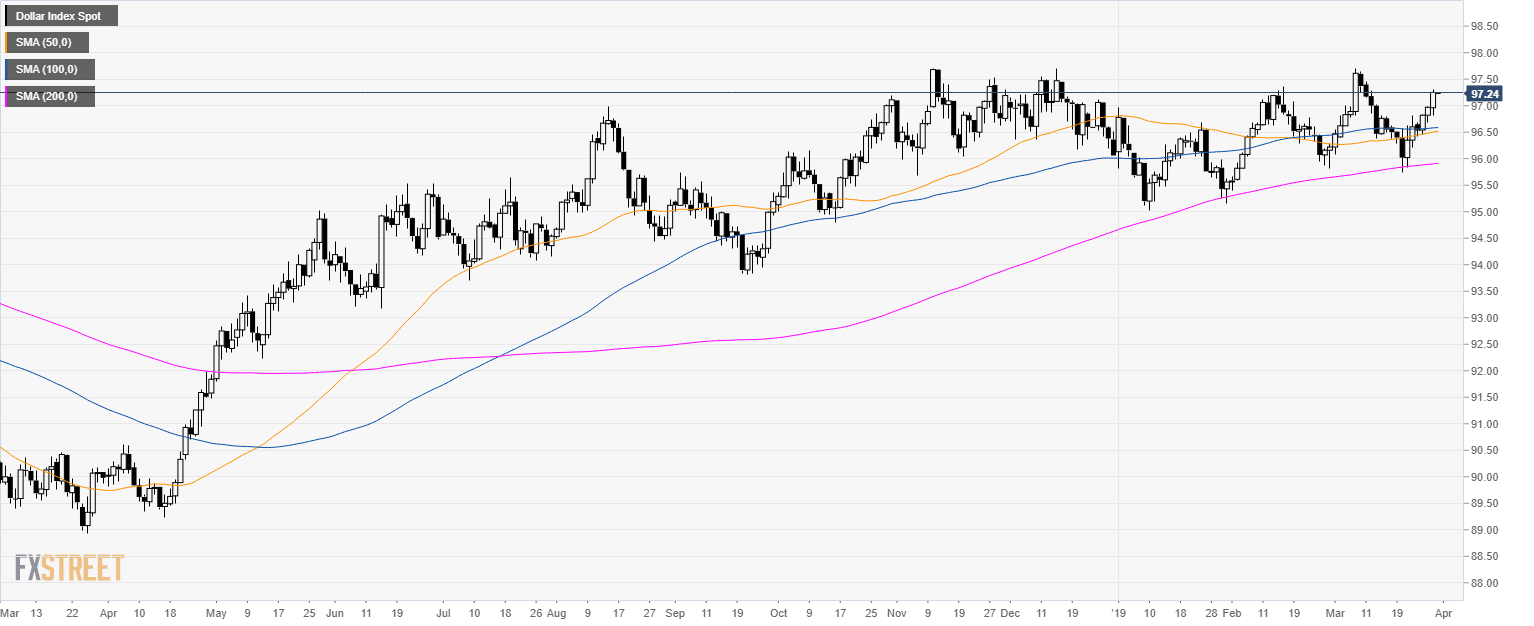
Home US Dollar Index Technical Analysis: Greenback climbing above 97.00 handle
FXStreet News

US Dollar Index Technical Analysis: Greenback climbing above 97.00 handle

DXY daily chart

  • The US Dollar Index (DXY) is trading in a bull trend above its 200-day simple moving average (SMA).
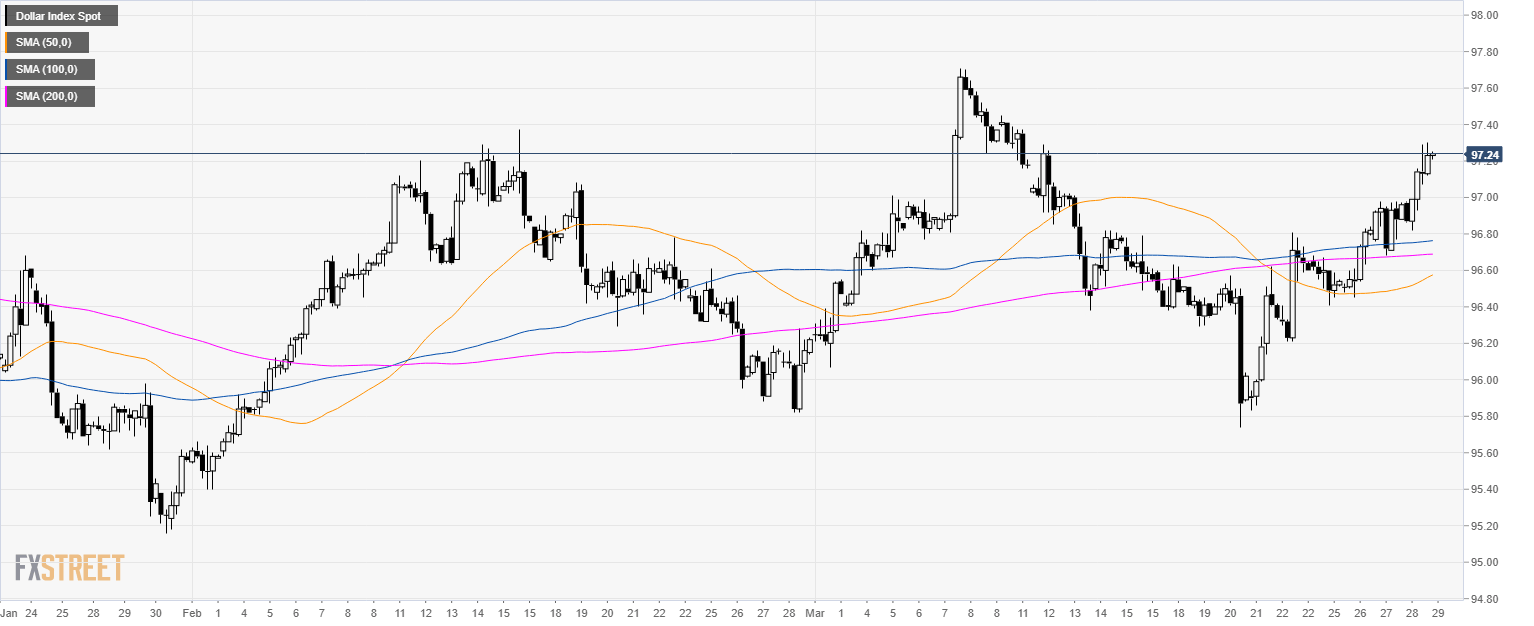
DXY 4-hour chart

  • DXY is trading above its main SMAs suggesting bullish momentum.
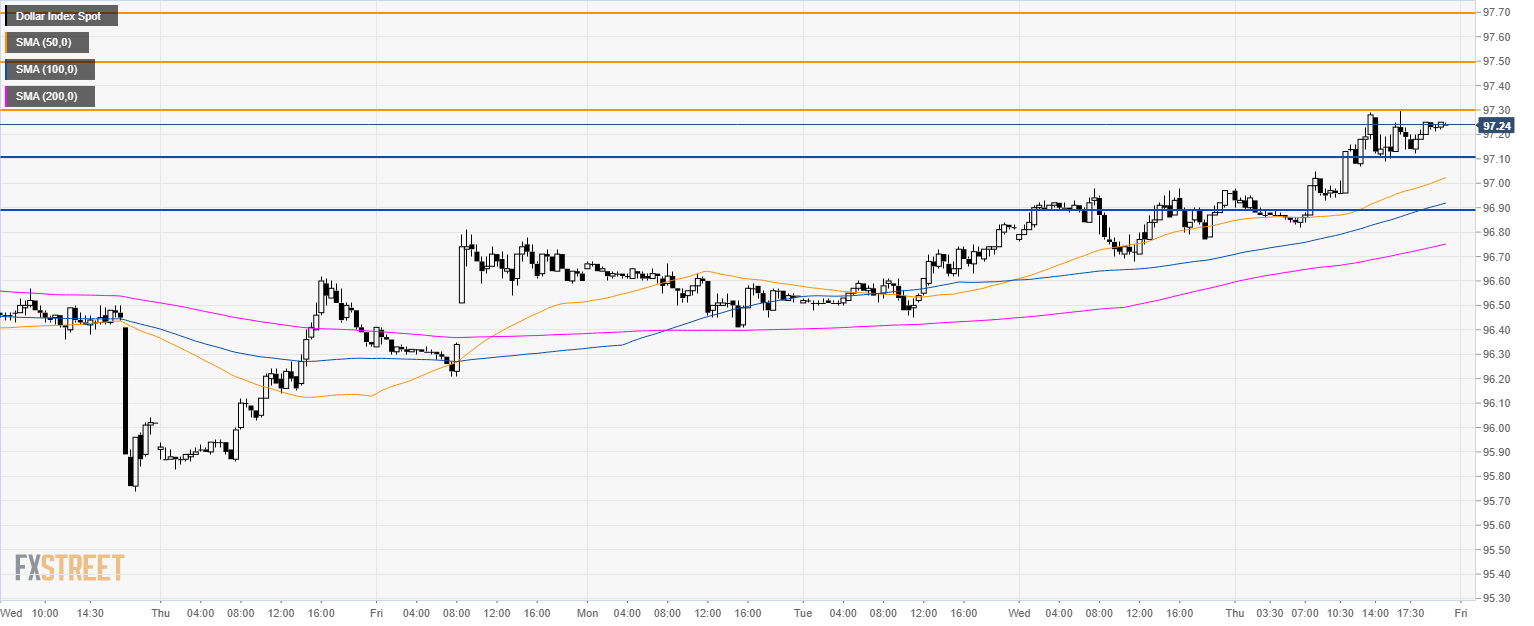
DXY 30-minute chart

  • DXY is trading above its main SMAs suggesting a bullish bias in the short-term.
  • A break above 97.60 resistance should lead to 97.50 and 97.70 if bulls have enough fuel.
  • Support is at 97.10 and  96.90 level.

Additional key levels


FX Street

FX Street

FXStreet is the leading independent portal dedicated to the Foreign Exchange (Forex) market. It was launched in 2000 and the portal has always been proud of their unyielding commitment to provide objective and unbiased information, to enable their users to take better and more confident decisions.