- AUD/NZD is trading around 1.0465 on early Tuesday.
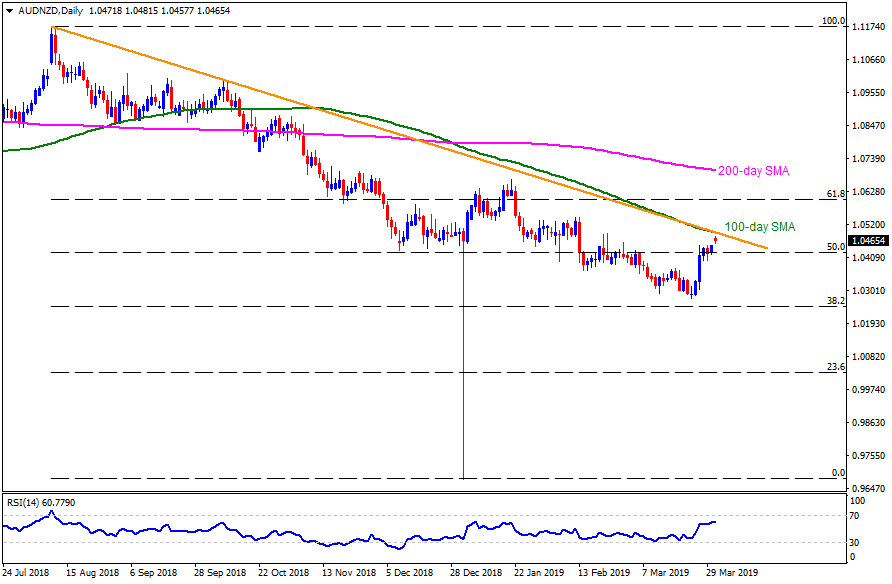
- The pair is at five-week high but is yet to conquer 1.0500 resistance-confluence comprising 100-day simple moving average (SMA) and an eight-month-old descending trend-line to justify its strength.
- Should the pair manage to provide a daily closing beyond 1.0500, 1.0545 and 61.8% Fibonacci retracement of August 2018 to January 2019 downpour, at 1.0605, can gain buyers’ attention ahead of January month high near 1.0670.
- However, the 200-day SMA level around 1.0700/05 could challenge bulls past-1.0670.
- On the flipside, 50% Fibonacci retracement level of 1.0425 can offer immediate support to the pair, a break of which can drag it to 1.0370 and 1.0320 rest-points.
- During the quote’s additional declines under 1.0320, 1.0300 and 1.0270 seem crucial as they hold the doors for a downward trajectory towards September 2019 low near 1.0230.
AUD/NZD daily chart