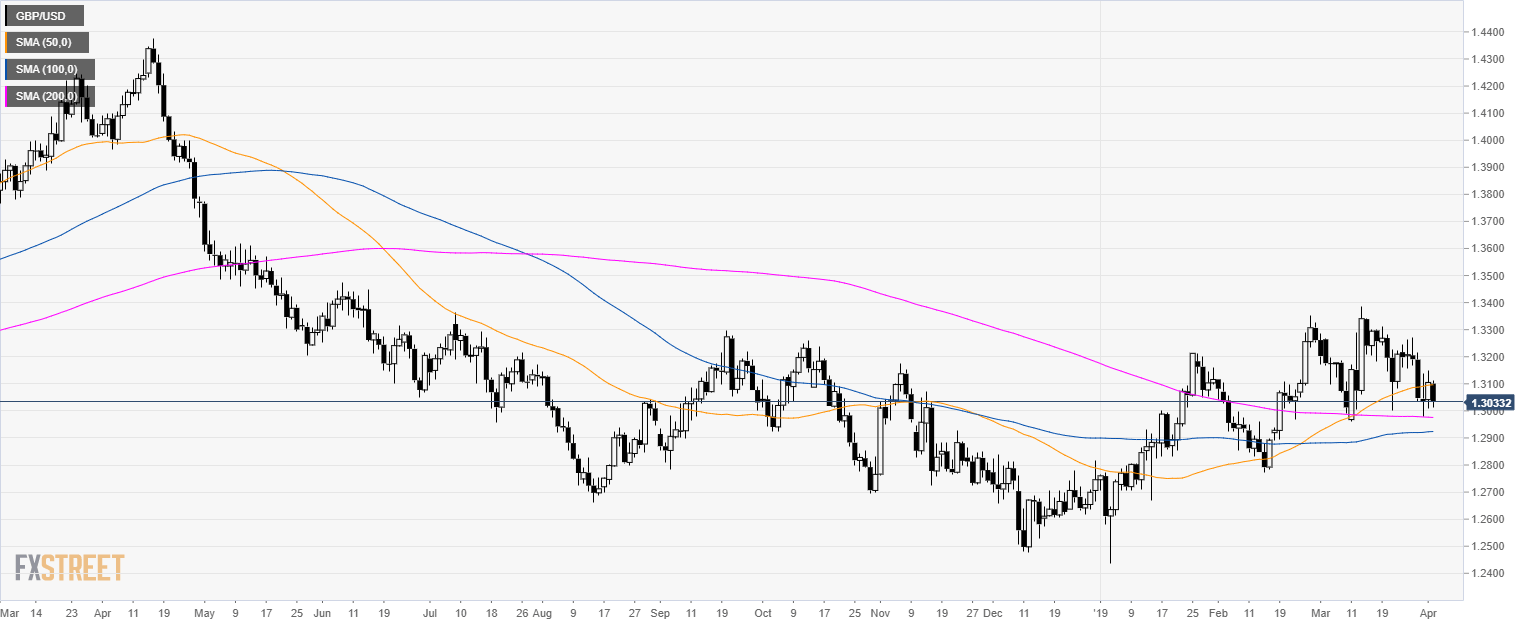
GBP/USD daily chart
- GBP/USD is consolidating above its 200-day simple moving average (SMA).
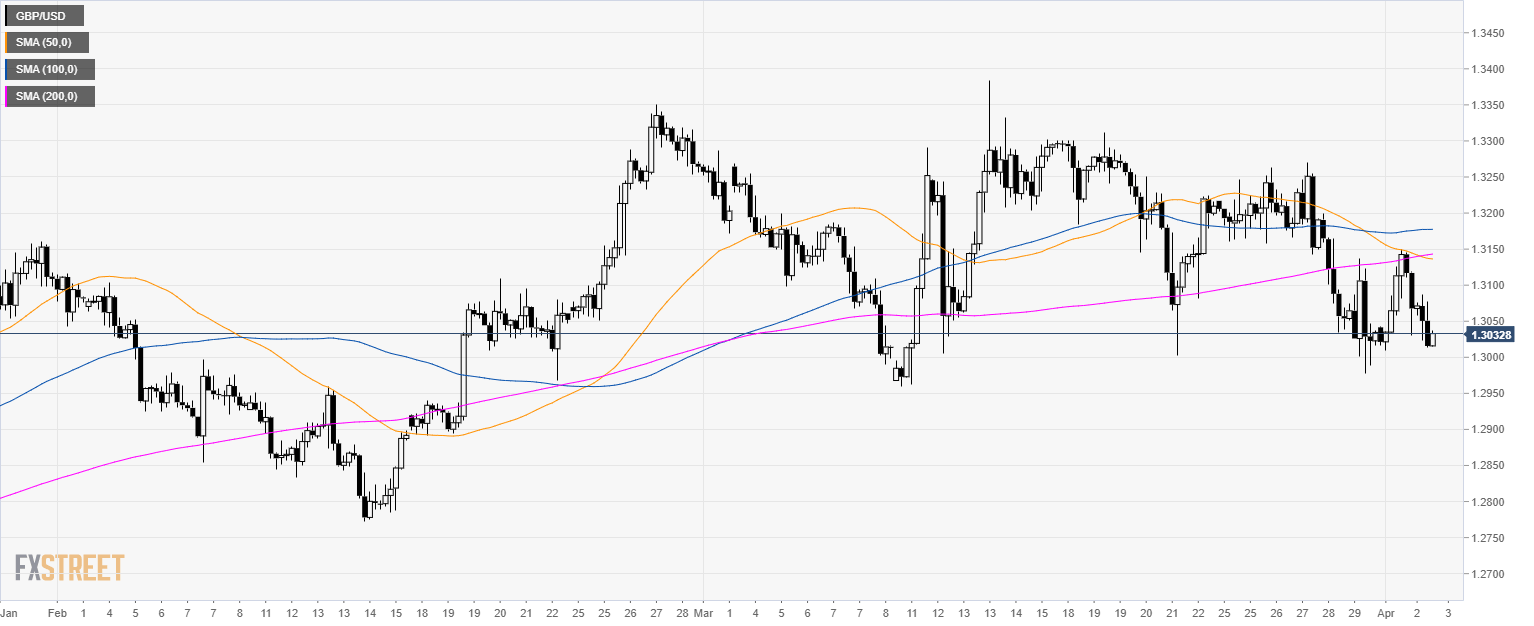
GBP/USD 4-hour chart
- GBP/USD is trading below its main SMAs.
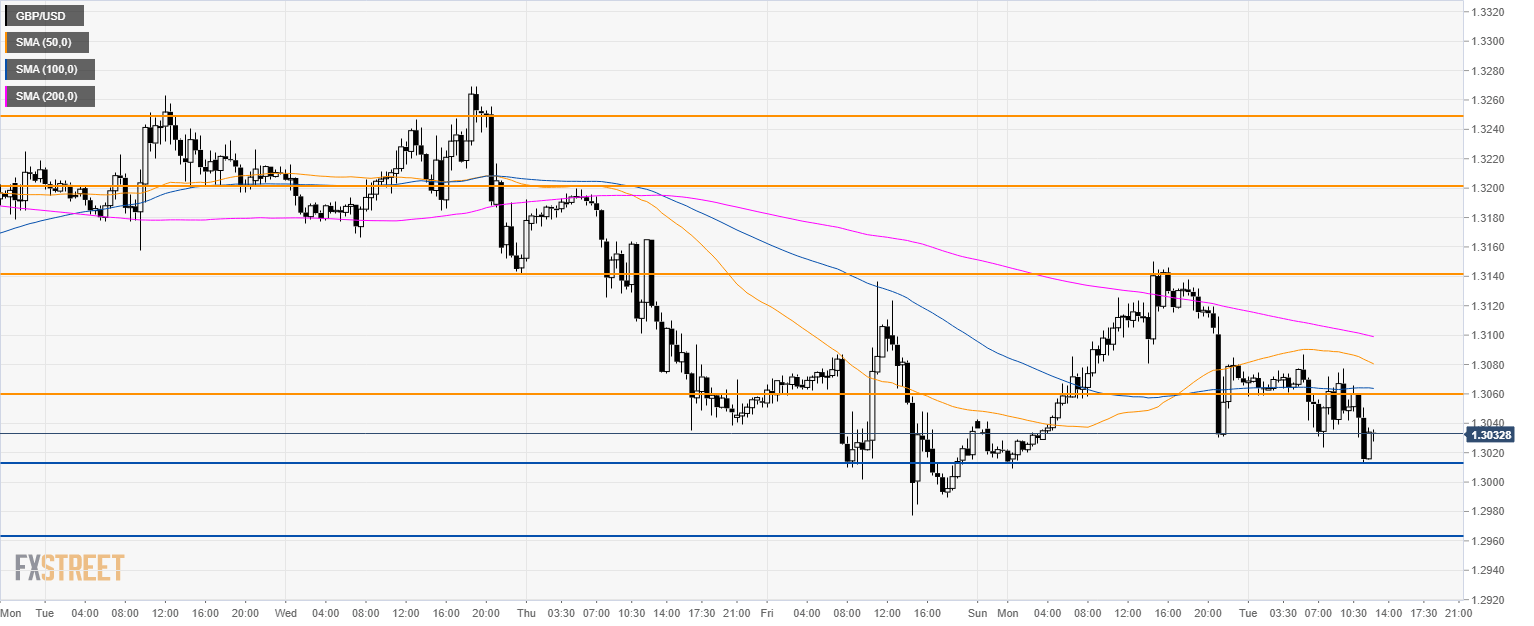
GBP/USD 30-minute chart
- GBP/USD is trading below its main SMAs suggesting a bearish bias.
- A break below 1.3015 key support is needed to extend the decline. The next supports to the downside are seen at 1.2960 and 1.2880 level.
- Resistance to the upside are at 1.3060, 1.3145 and 1.3200 figure.
Additional key levels
