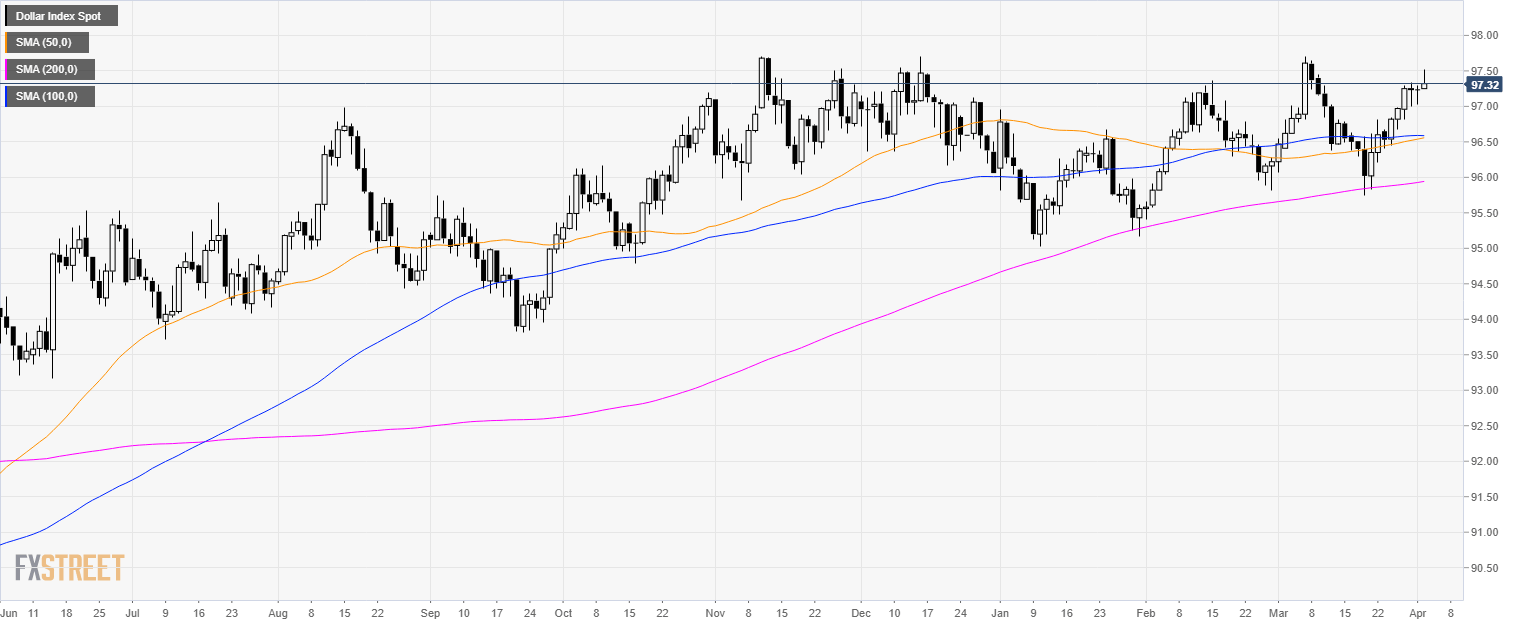
DXY daily chart
- The US Dollar Index (DXY) is trading in a bull trend above its 200-day simple moving average (SMA).
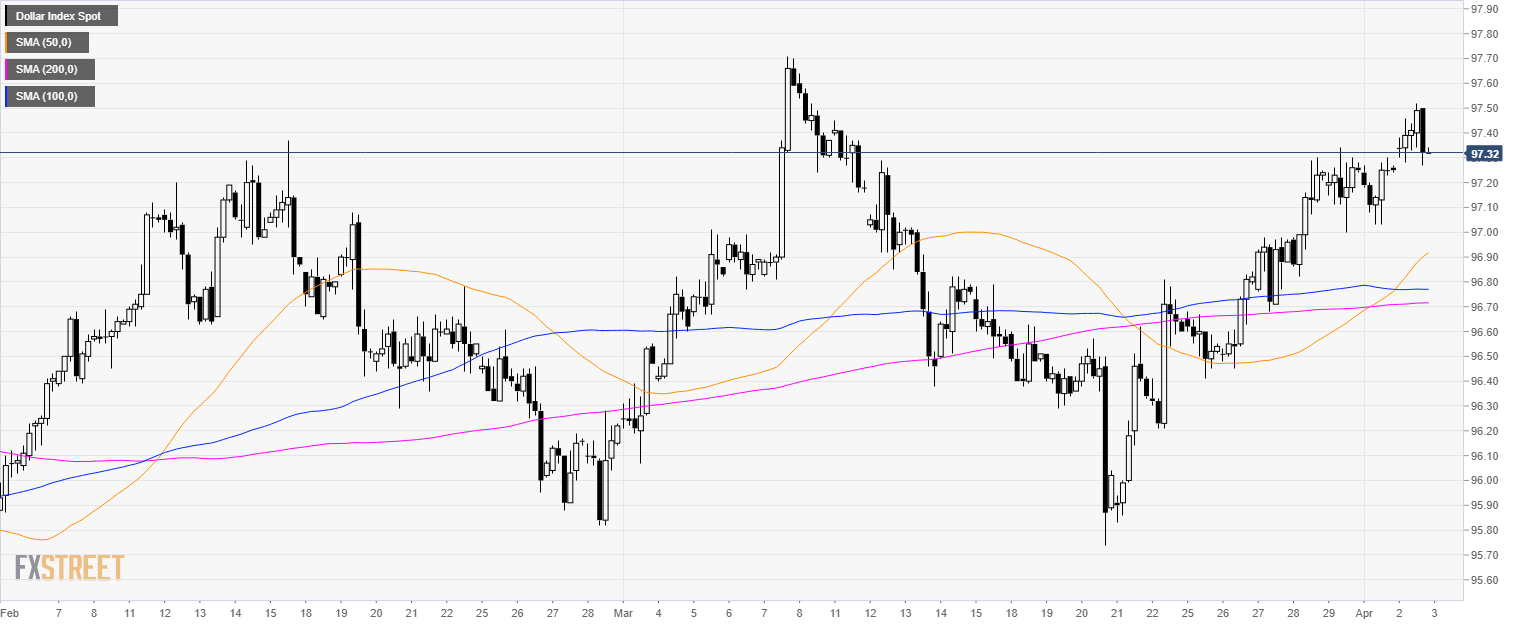
DXY 4-hour chart
- DXY is trading above its main SMAs suggesting bullish momentum in the medium-term.
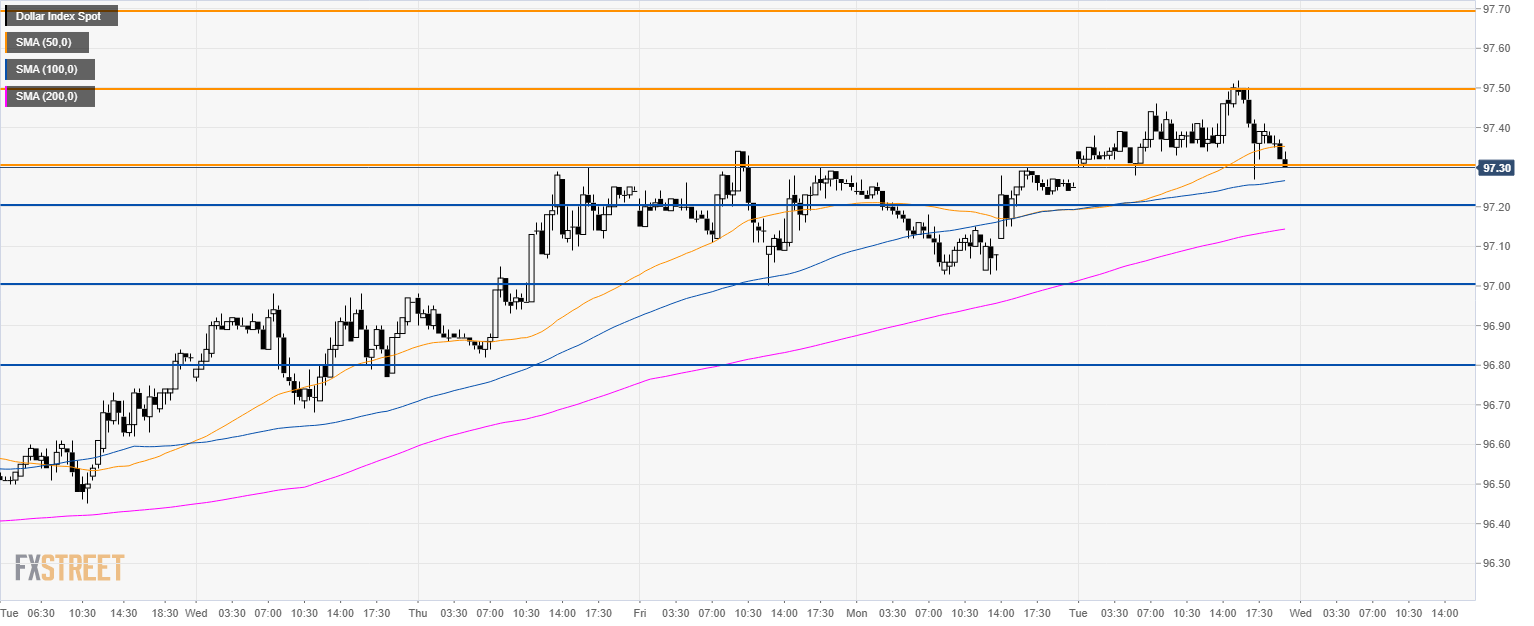
DXY 30-minute chart
- DXY is trading between the 50 and 100 SMA, suggesting a consolidation in the short-term.
- The level to beat for bulls is 97.50 and 97.70 key resistances.
- Bears will be looking at 97.20, 97.00 and 96.80 support.
Additional key levels
