- Gold trades around $1293 while heading into European session on Wednesday.
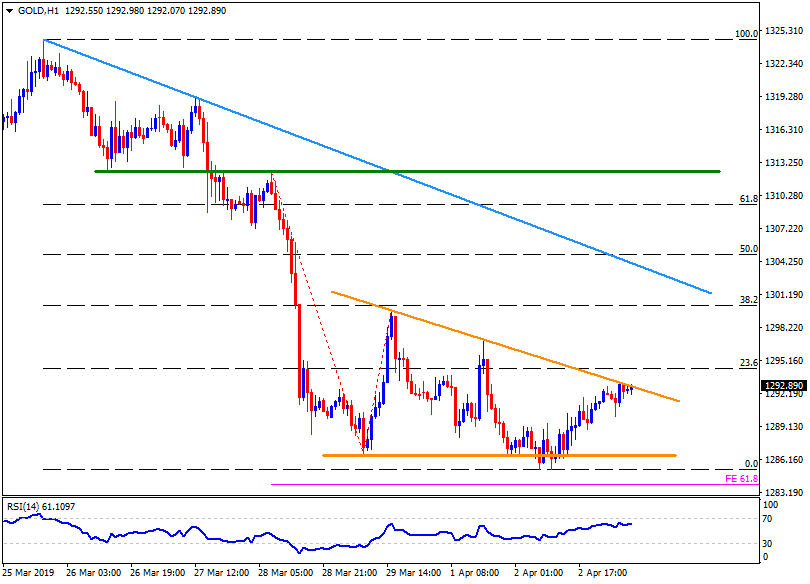
- If observing the yellow metal’s trading behavior since March 29, it forms a short-term descending triangle pattern on the hourly chart.
- The bullion presently struggles with the resistance-line, a break of which could escalate recent recovery towards $1300.
- However, upside past-$1300 might find it hard to clear descending trend-line stretched since March 25, at $1305, followed by $1308 resistance-level.
- It should also be noted that the quote’s upside beyond $1308 needs to clear $1312.50 – $1313 horizontal-region to aim for $1320 and $1325.
- Meanwhile, $1290 could limit the bullion’s nearby declines ahead of highlighting pattern support around $1287.
- Given the prices slip under $1287, recent lows near $1285 and 61.8% Fibonacci expansion (FE) level of $1283 could please sellers.
Gold hourly chart