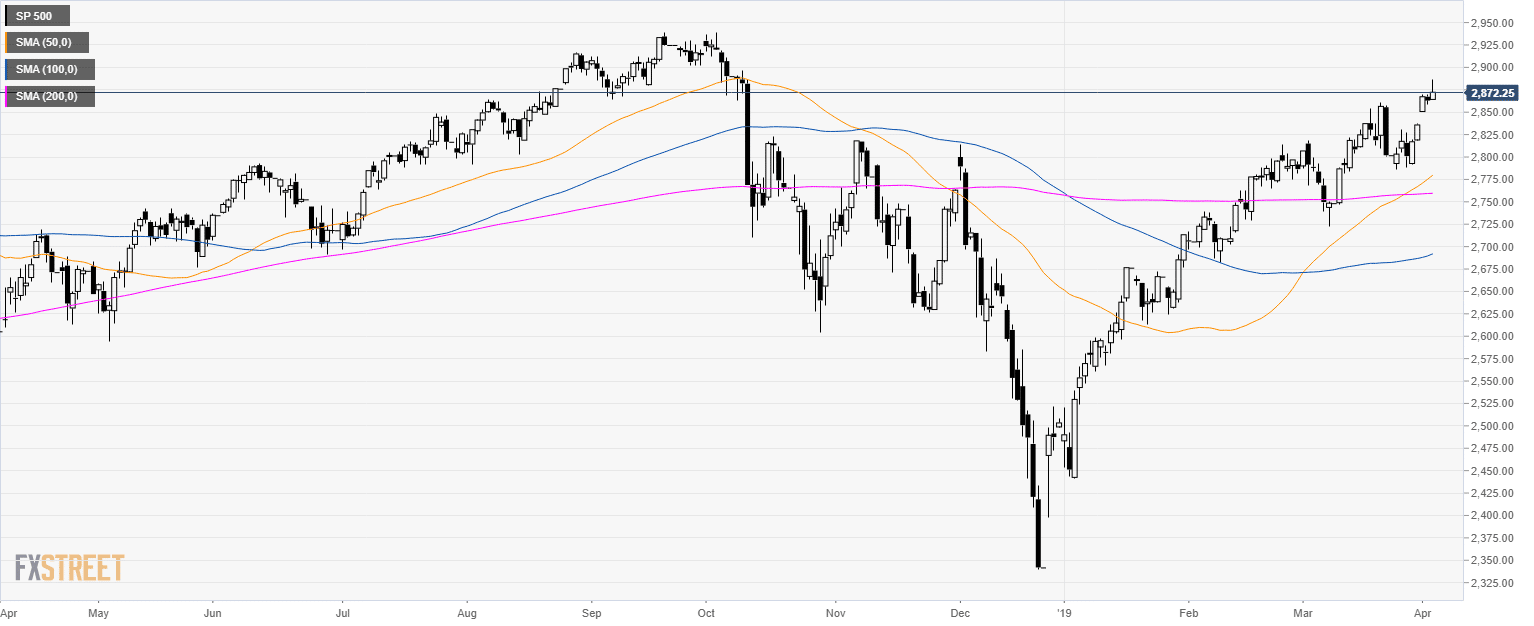
S&P500 daily chart
- The S&P500 is trading above its main simple moving averages (SMAs) suggesting bullish momentum.
- As mentioned yesterday, the market found resistance just below the 2,890.00 resistance.
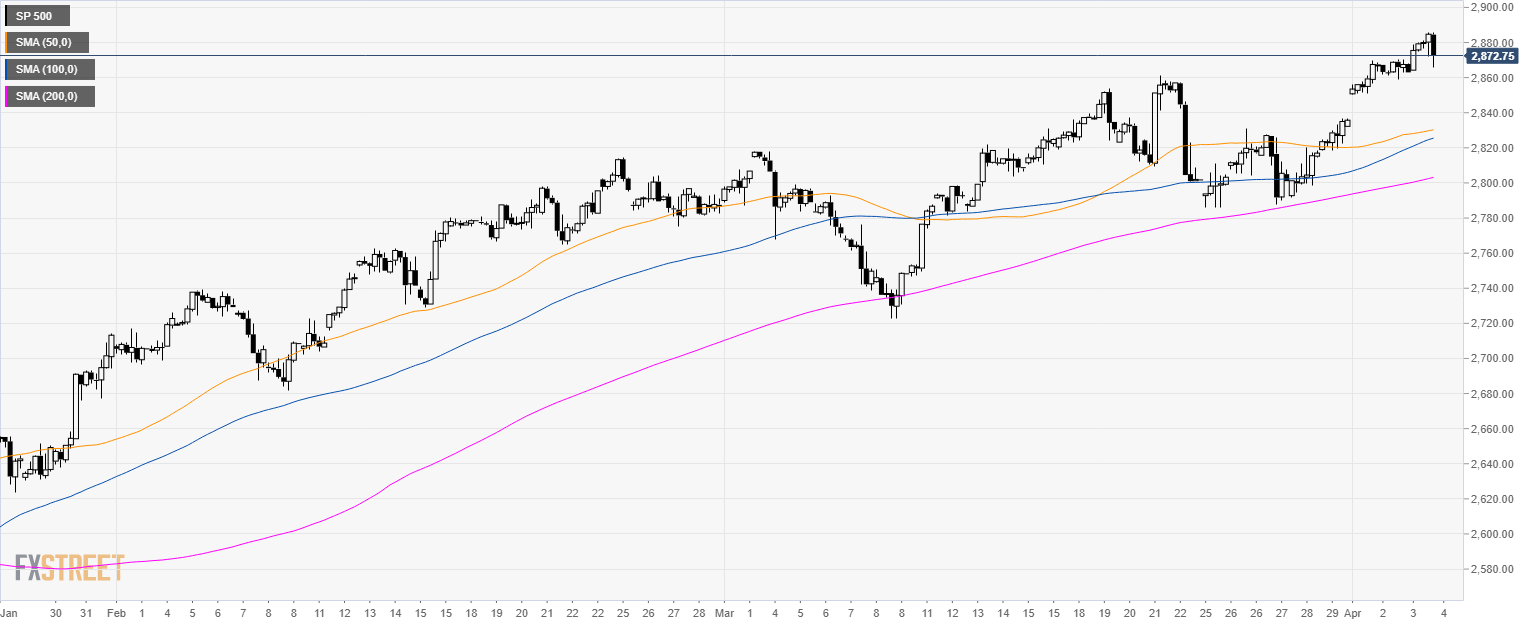
S&P500 4-hour chart
- The S&P500 is trading above its main SMAs suggesting a bullish bias in the medium-term.
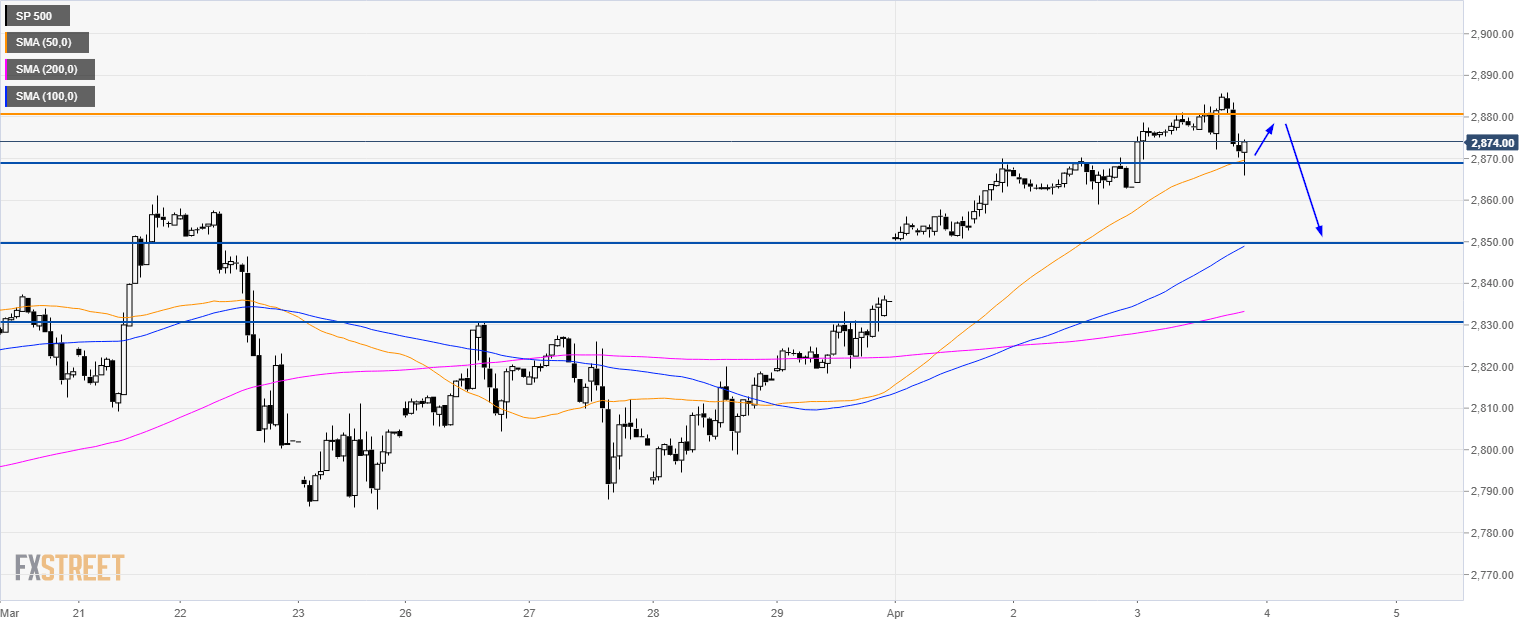
S&P500 60-minute chart
- The S&P500 is trading above its main SMAs as the market found support at the 50 SMA.
- Bulls will likely bring the market to 2,880.00 resistance before a potential drop to 2,850.00
- Further down, the next level of support is seen at 2,830.00 level.
Additional key levels
