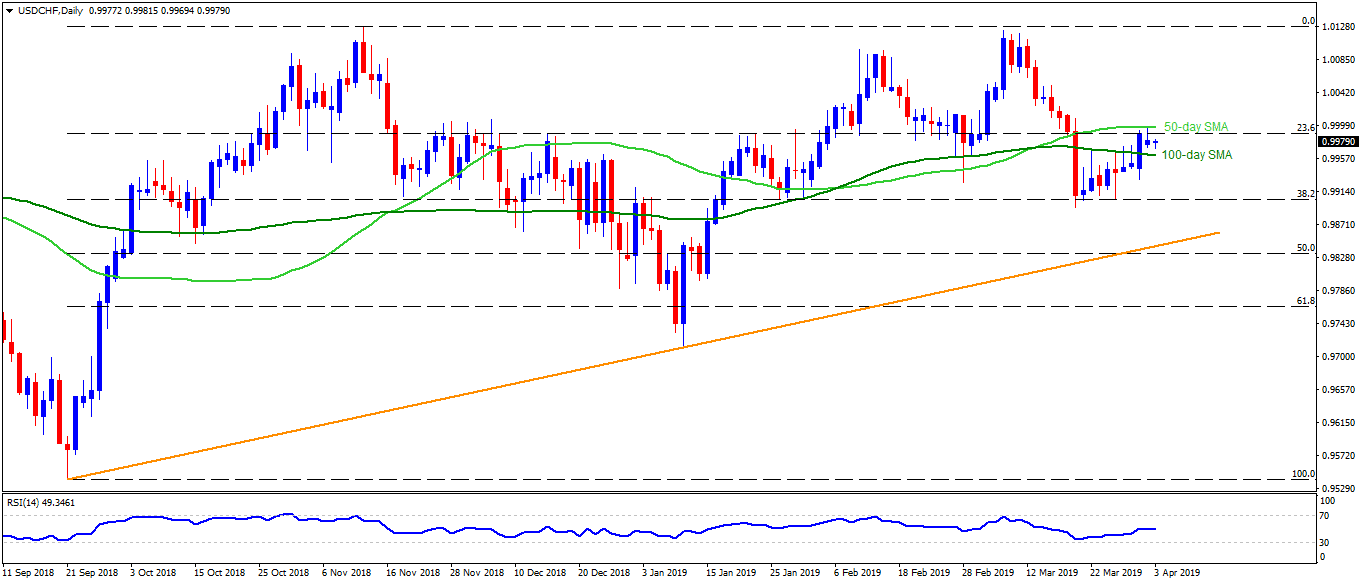
USD/CHF daily chart
- USD/CHF is taking the bids near 0.9980 at the initial Asian trading on Wednesday.
- The quote gradually recovered from 38.2% Fibonacci retracement of it September – November rise but couldn’t clear 50-day simple moving average (SMA) during its recent journey.
- 100-day SMA level of 0.9960 can act as immediate support for the pair ahead of dragging it to 0.9930 and 38.2% Fibonacci retracement level of 0.9900.
- In a case where prices keep declining under 0.9900, 0.9860 and an upward sloping trend-line since September could confine further downside near 0.9845.
- Meanwhile, break of 1.0000 mark comprising 50-day SMA can escalate recent recovery towards 1.0020 and 1.0040.
- Though, 1.0070, 1.0100 and 1.0130 could challenge buyers past-1.0040.
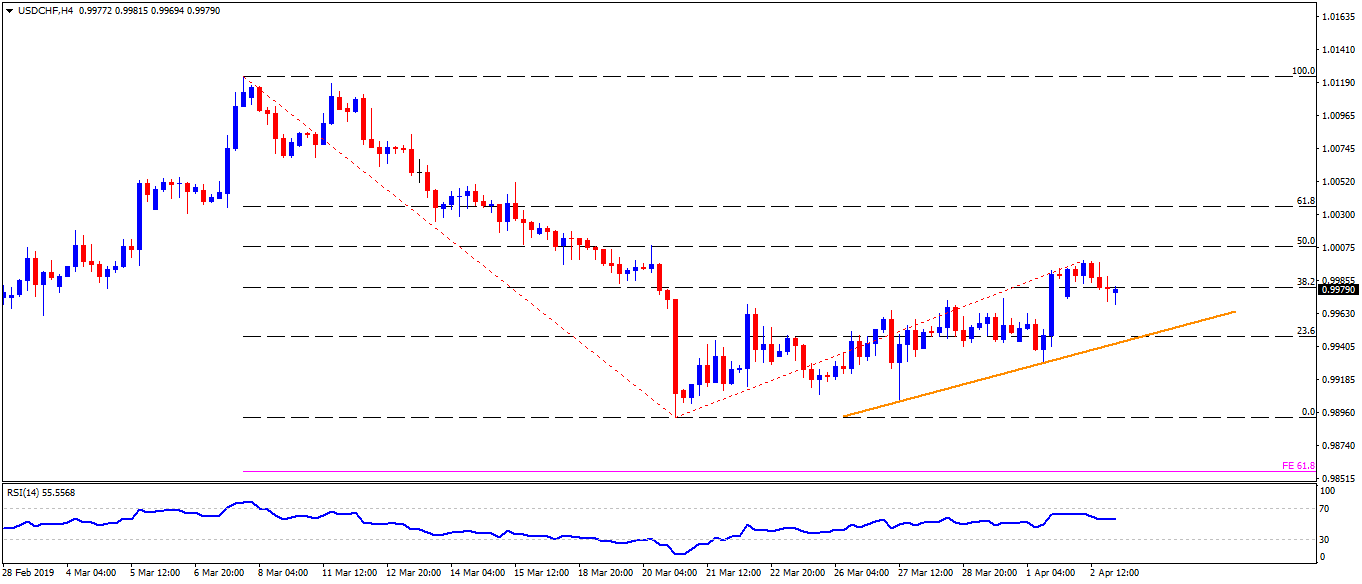
USD/CHF 4-Hour chart
- An immediate ascending trend-line at 0.9940 can provide intermediate rest between 0.9960 and 0.9930.
- 1.0055/60 is likely additional upside barrier on H4.
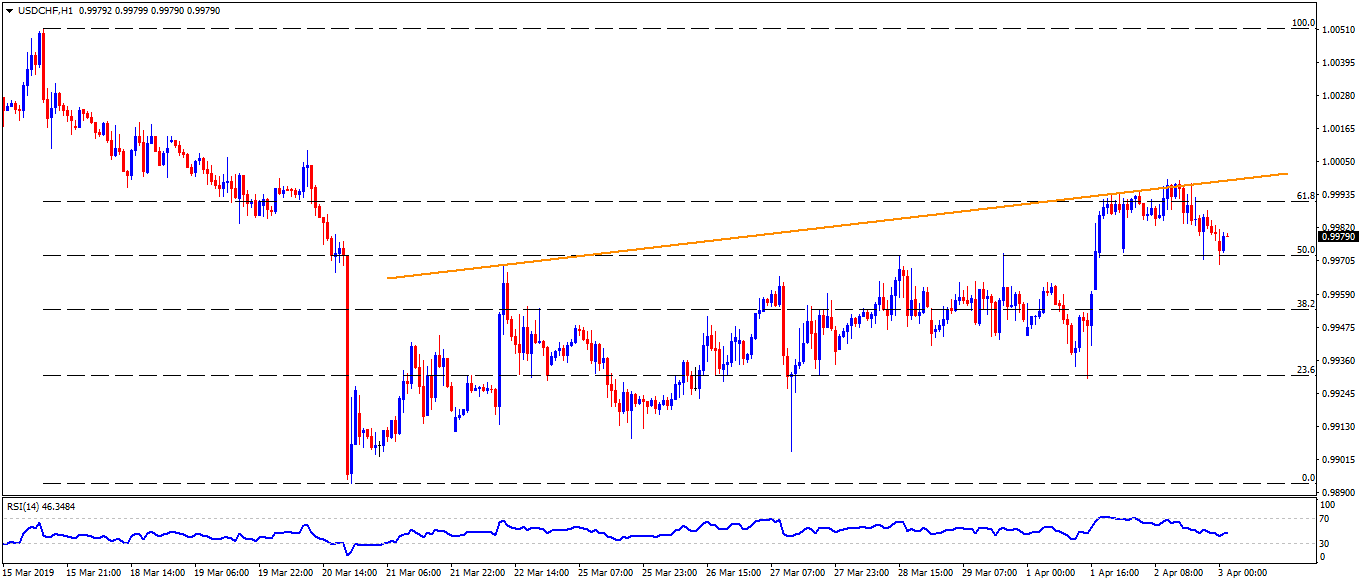
USD/CHF hourly chart
- 0.9970 seems the closest support with 0.9910 being an additional filter on the downside.
- 1.0015 could become an extra stop during the quote’s rise past-1.0000.