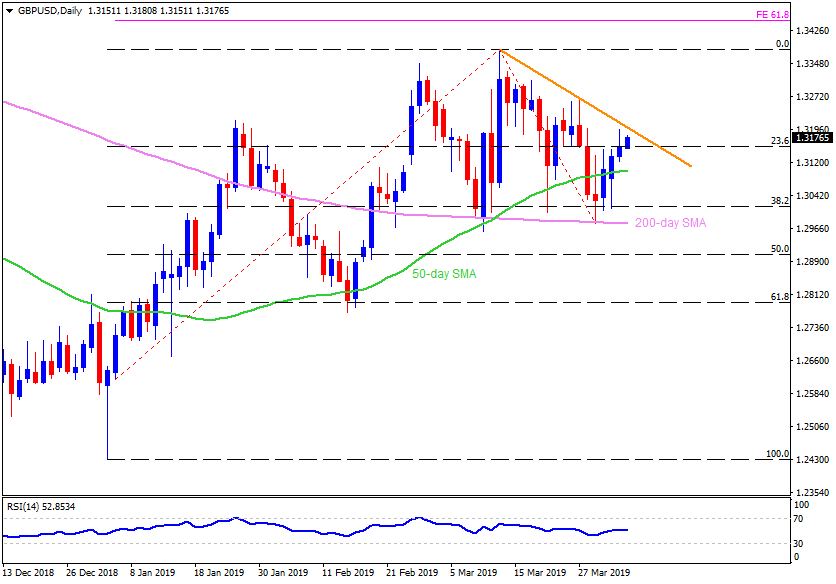
GBP/USD daily chart
- GBP/USD trades near 1.3175 during early Thursday while heading towards 1.3200/3210 resistance area that comprises three-week long descending trend-line.
- Should prices manage to clear 1.3210 barrier, 1.3270, 1.3330 and March highs near 1.3380 could please buyers ahead of challenging them with 61.8% Fibonacci expansion (FE) of its January-March moves around 1.3450.
- Alternatively, 50-day SMA level of 1.3100 could become nearby support, a break of which can drag the quote to 1.3030, 1.3000 and then to 200-day SMA level of 1.2980.
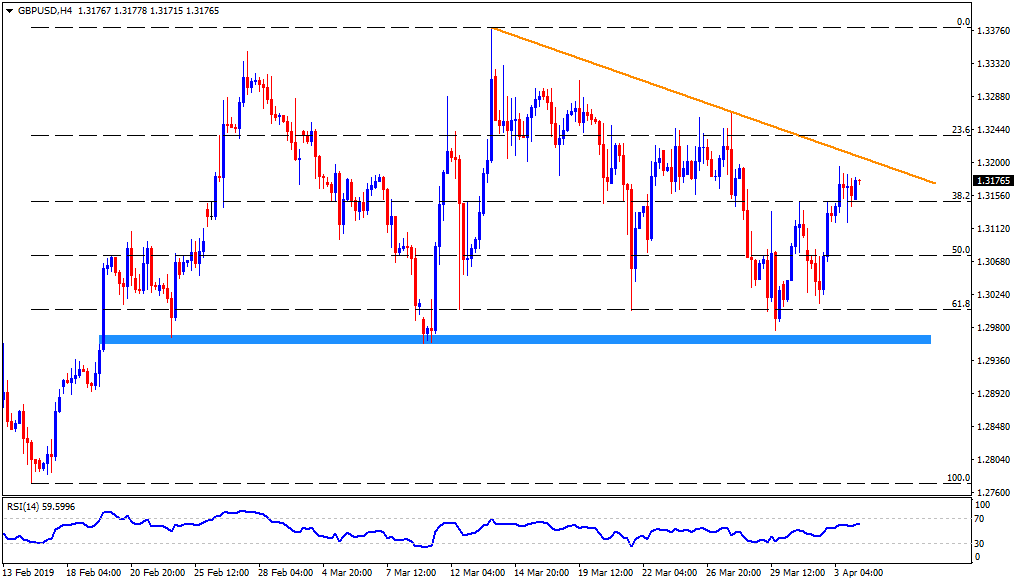
GBP/USD 4-Hour chart
- 1.3300 round-figure can act as an intermediate halt between 1.3270 and 1.3330.
- 1.2970/60 region comprising lows marked since late-February could validate pair’s declines towards 1.2890 after the break of 1.2980.
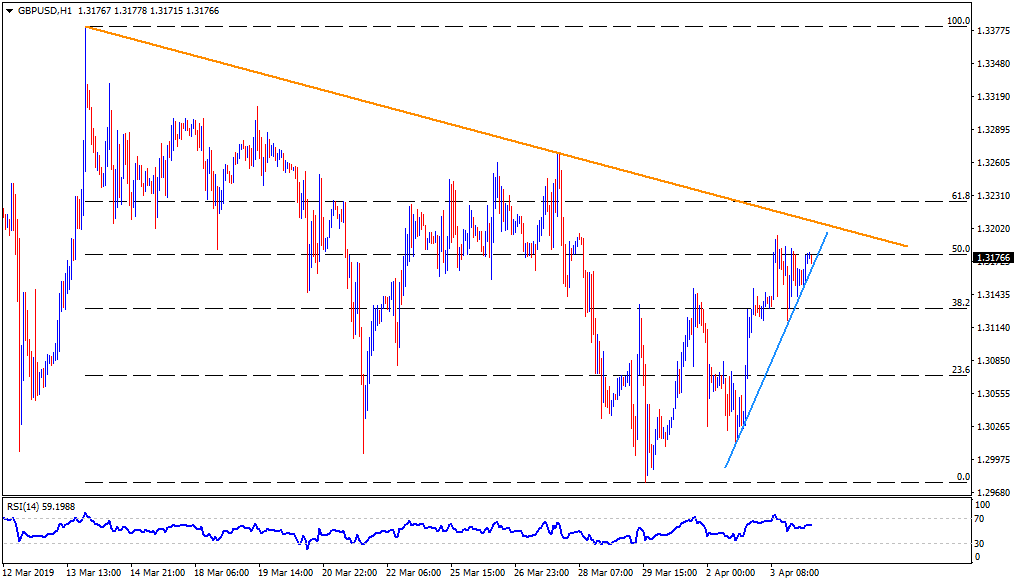
GBP/USD hourly chart
- An ascending trend-line connecting recent lows can offer the closest support near 1.3160.