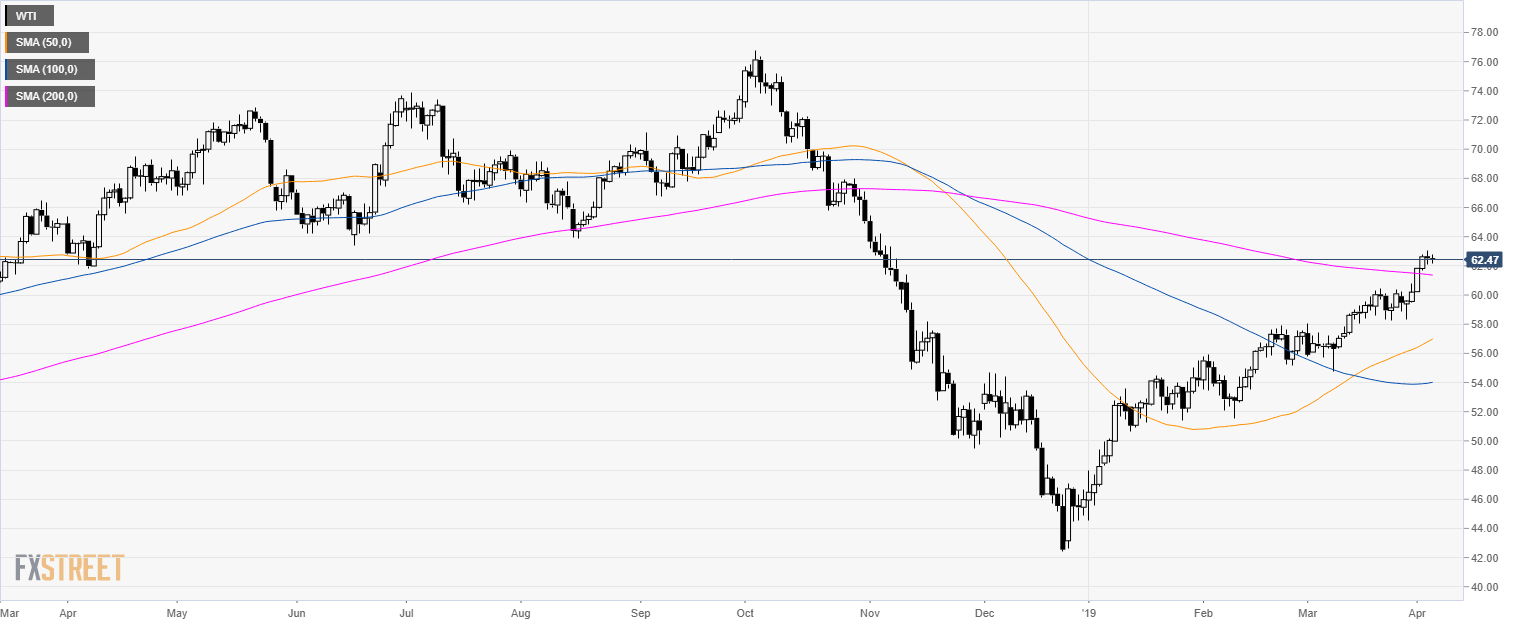
Oil daily chart
- WTI is trading above its main simple moving averages (SMA) suggesting a bullish bias.
- As mentioned previously, WTI reached the 63.00 resistance.
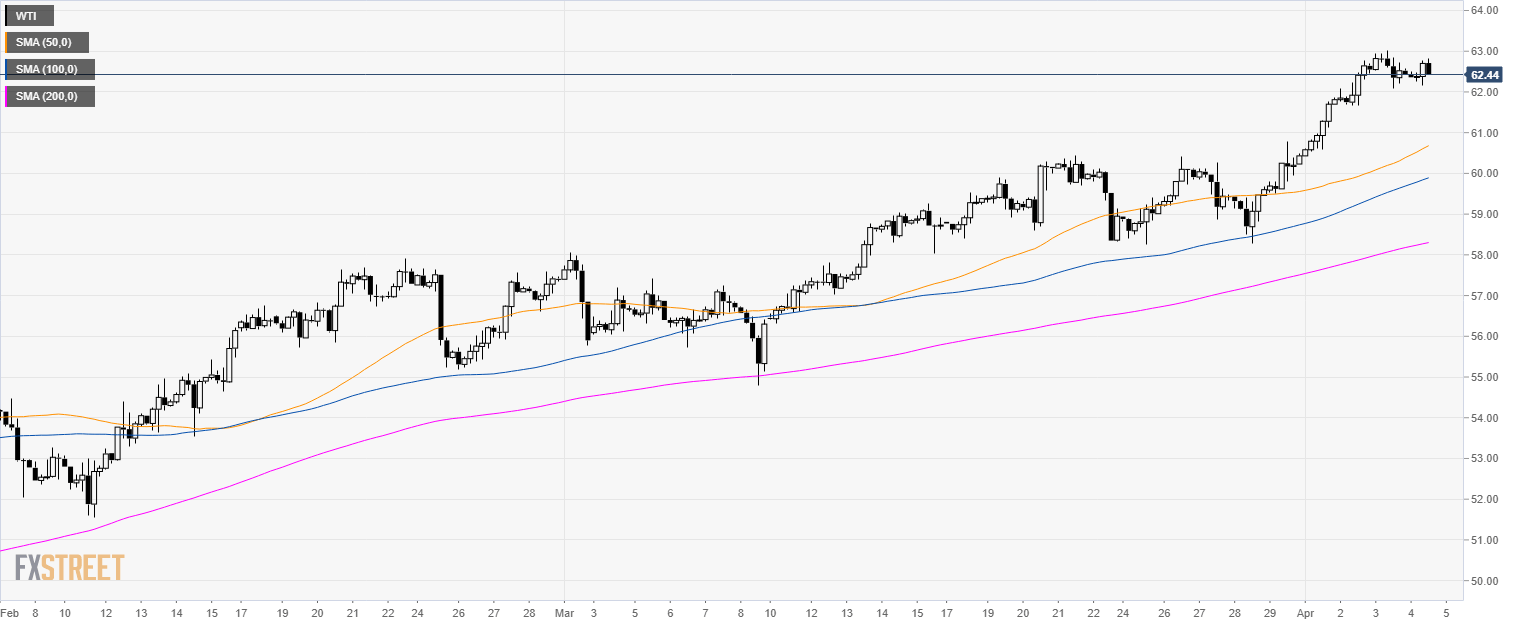
Oil 4-hour chart
- Crude oil WTI is trading above its main SMAs suggesting a bullish bias in the medium-term.
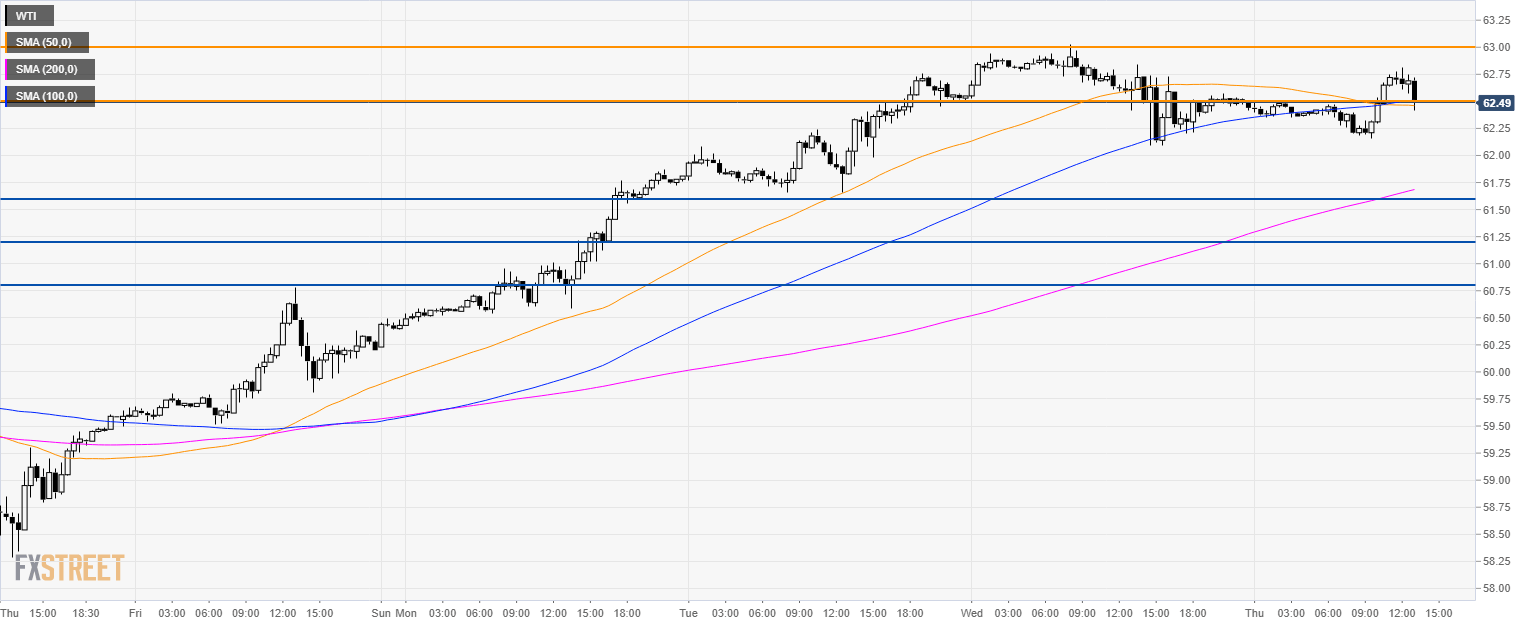
Oil 30-minute chart
- The main trend is still bullish however, the 50 SMA is crossing below the 100 SMA suggesting a potential correction in the near-term.
- Bears could initially be looking at 61.60 followed by 61.25 and 60.75 level if they gather enough steam.
- Resistance is at 63.00 and 63.50 level.
Additional key levels
