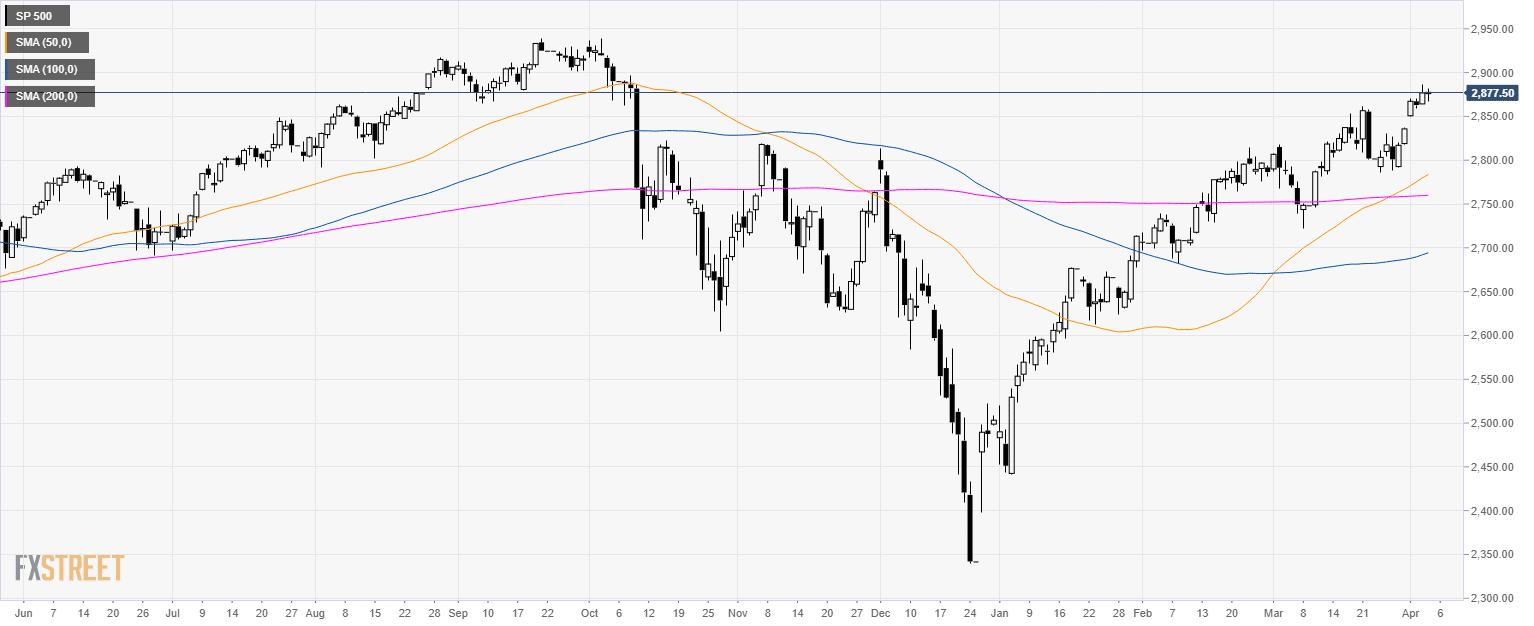
S&P500 daily chart
- The S&P500 index is trading above its main simple moving averages (SMAs) suggesting bullish momentum.
- As mentioned yesterday, the market had a push to the 2,880.00 level where the index found resistance.
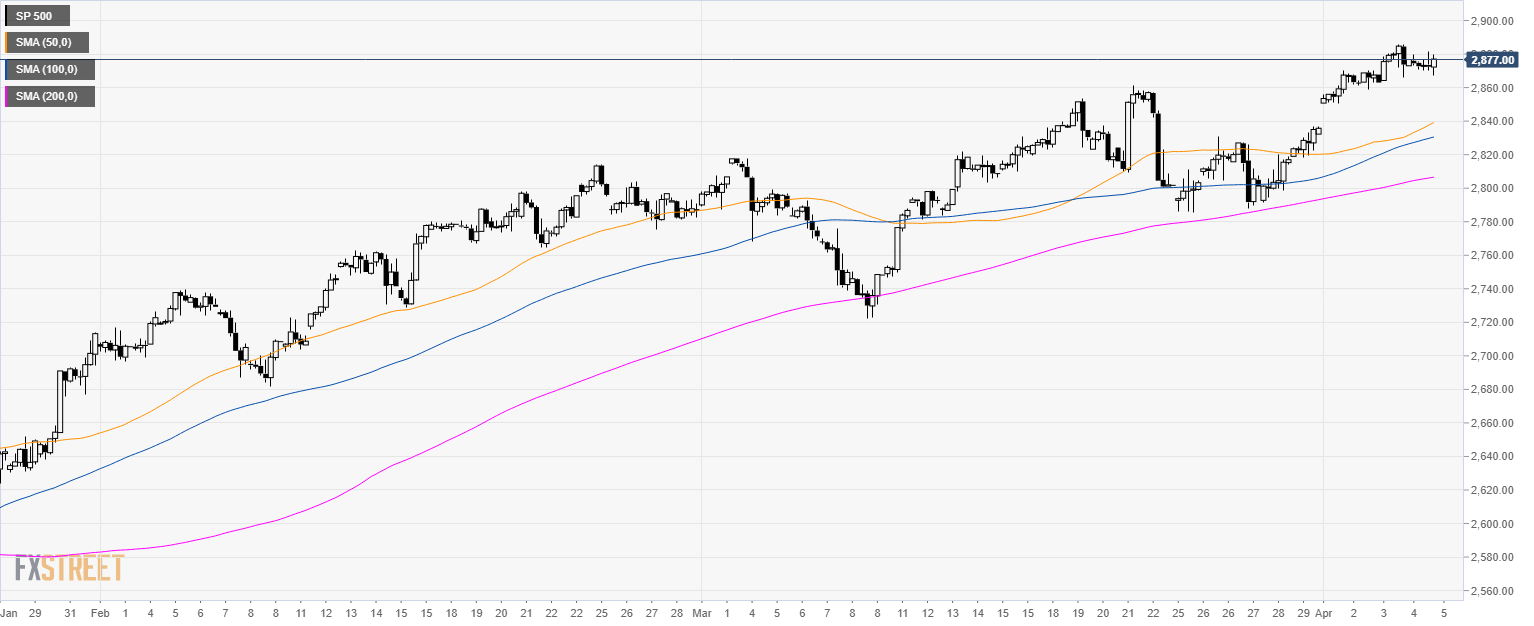
S&P500 4-hour chart
- The S&P500 is trading above its main SMAs suggesting a bullish bias in the medium-term.
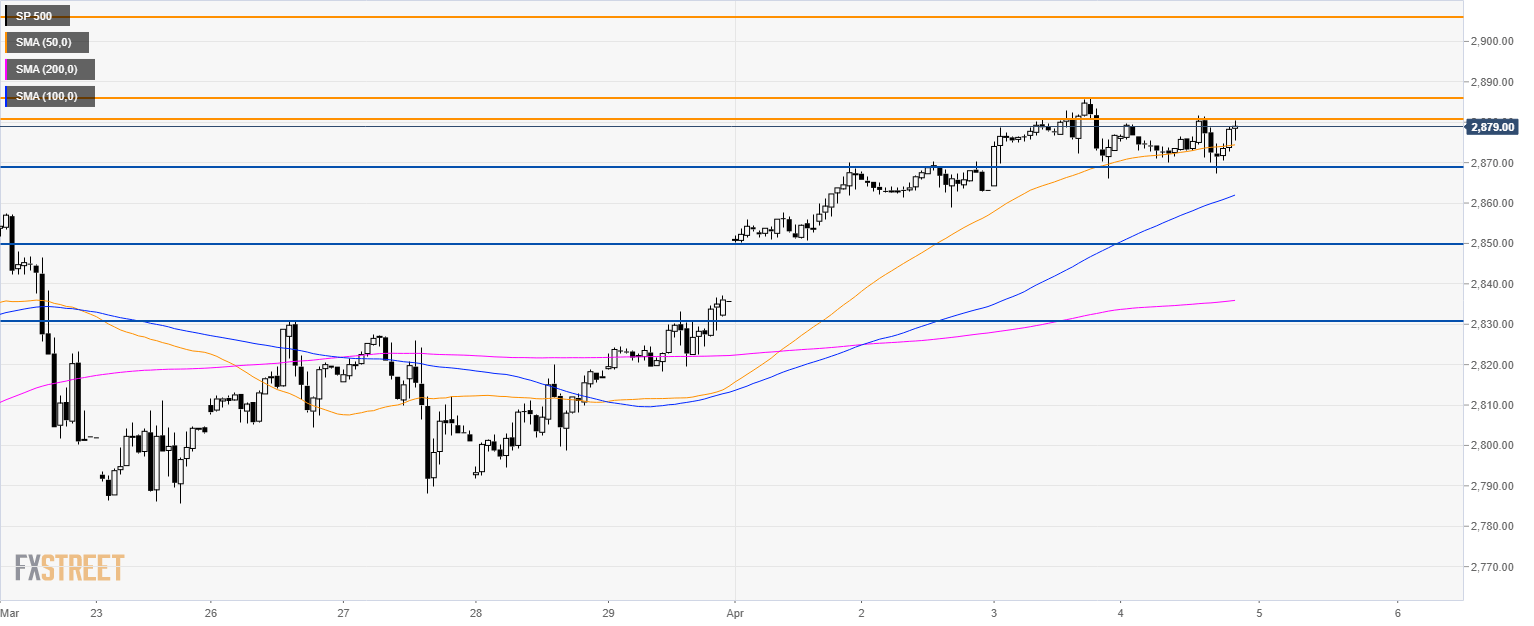
S&P500 60-minute chart
- As the market is holding above its 50 SMA another attempt at 2,886.00 can be on the cards.
- However, a break above the level can lead to 2,906.00 resistance.
- 2,886.00 is a key resistance and a failure there can potentially see the S&P500 down to 2,850.00 level.
Additional key levels
