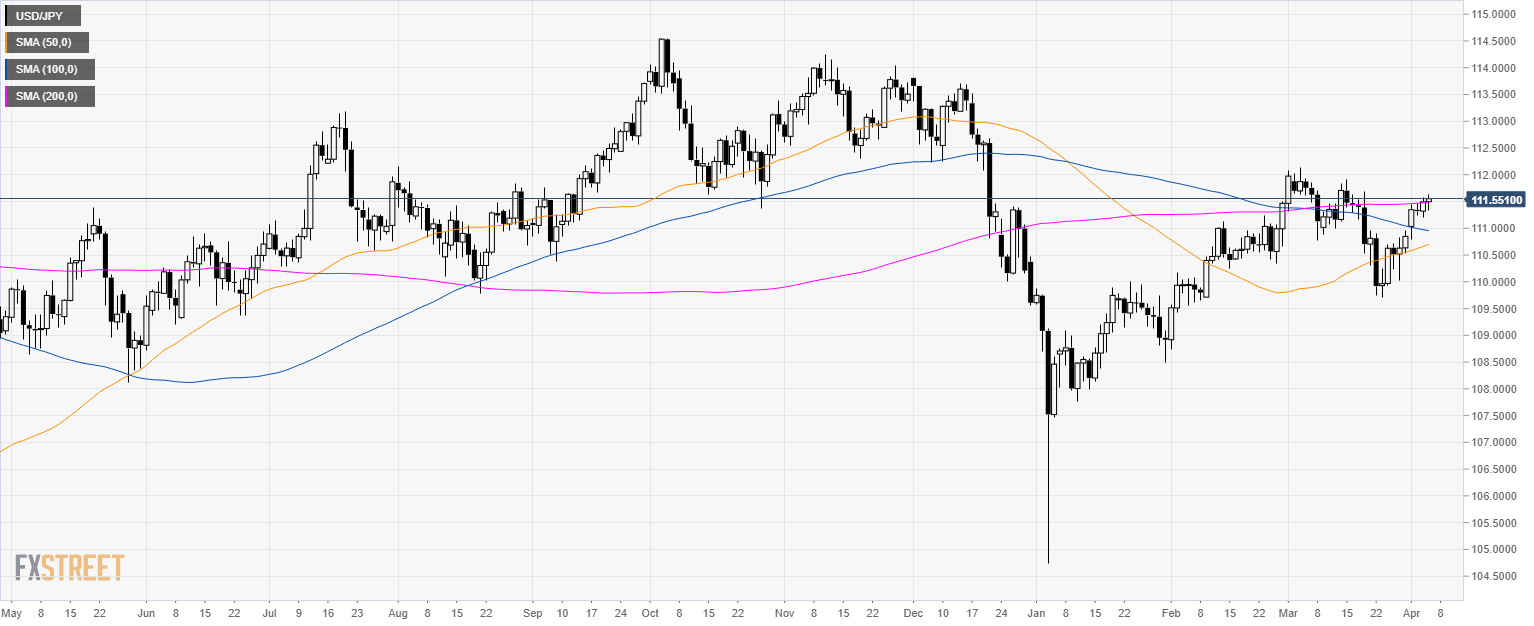
USD/JPY daily chart
- USD/JPY is consolidating just above the 111.50 resistance and the 200-day simple moving average (SMA).
- As mentioned yesterday, USD/JPY remained bullish and broke above 111.50 resistance.
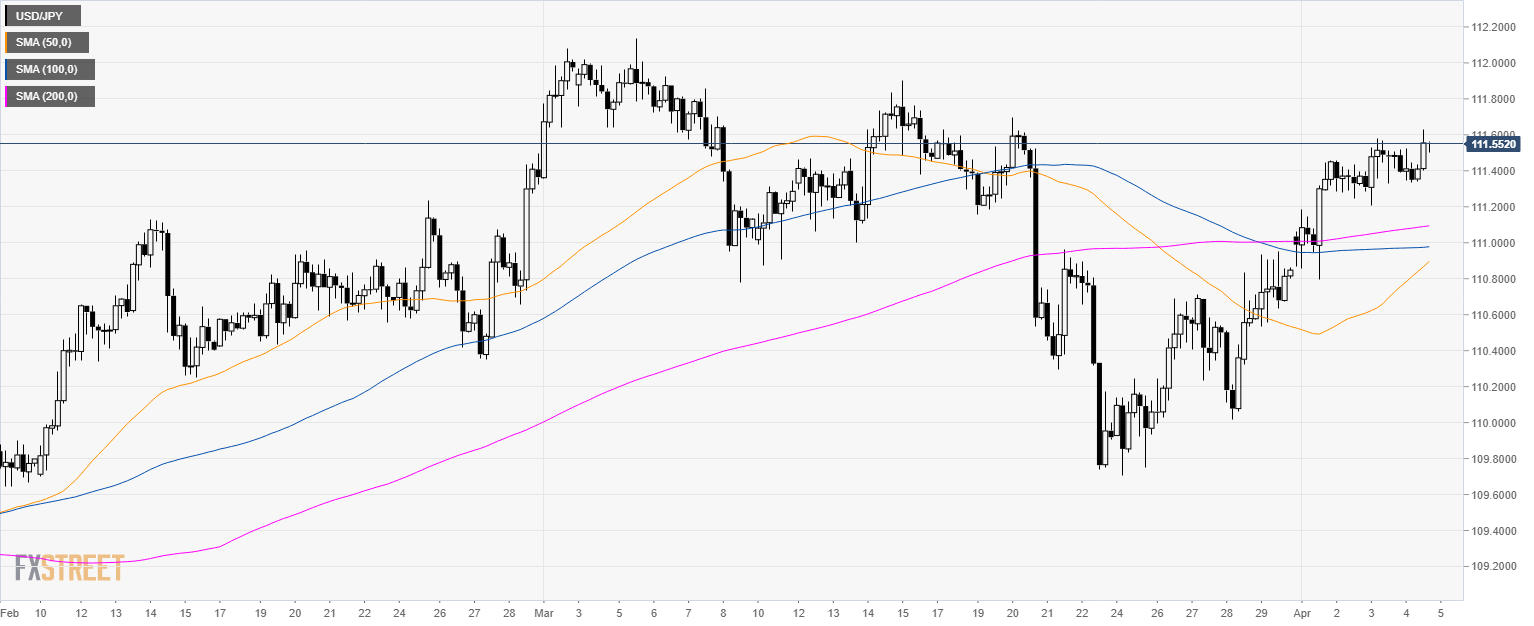
USD/JPY 4-hour chart
- USD/JPY is trading above its main SMAs suggesting a bullish bias in the medium-term.
USD/JPY 30-minute chart
- USD/JPY is grinding up above its main SMAs suggesting a bullish bias in the short-term.
- The bulls broke above the 111.50 resistance. The next resistance is seen at the 111.80 and the 112.00 figure.
- Looking to the downside, support is at 111.20, 111.00 and 110.80 level.
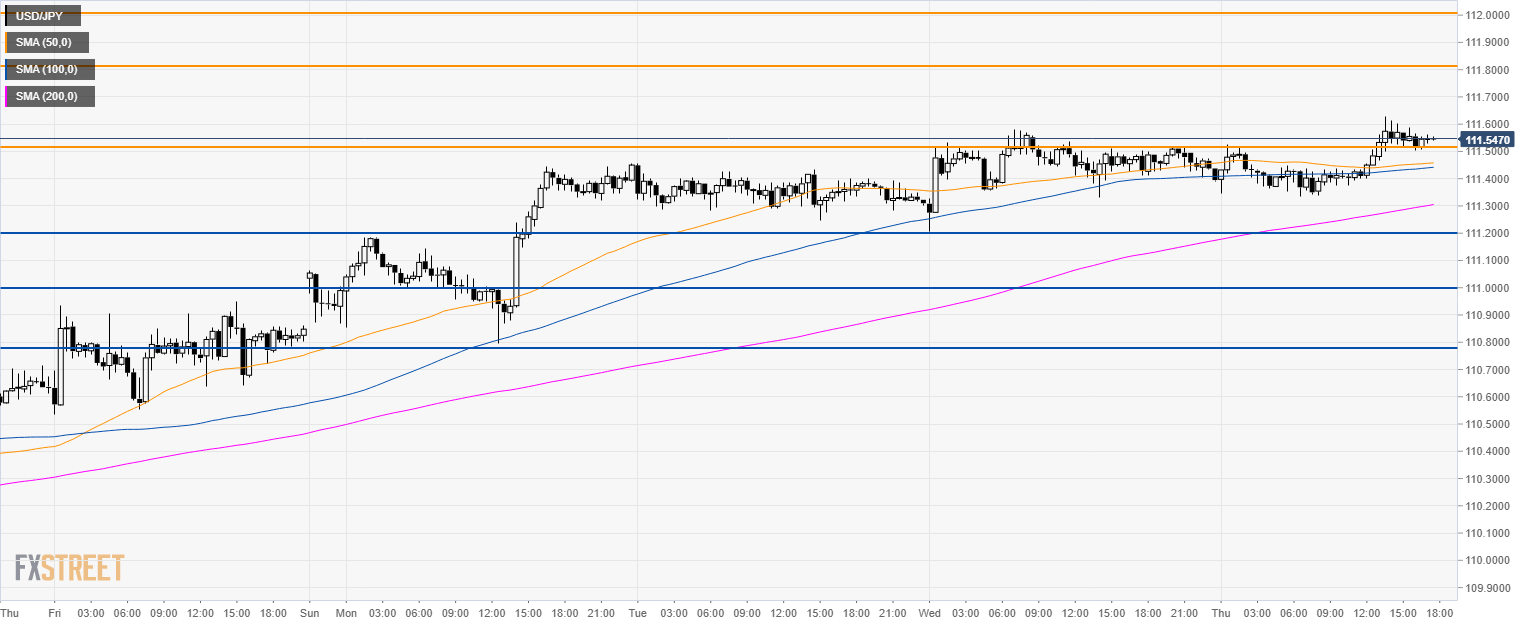
Additional key levels
