The NZD/USD pair is struggling around 0.6750 during early Friday as ten-week-old ascending trend-line and 200-day simple moving average (SMA) limits the quote’s immediate downside triggered after multiple failures to clear 0.6800 mark.
Should the pair slips beneath the 0.6750-35 support-zone, it can quickly drop to 0.6710 and then to 50% Fibonacci retracement of October – December upside, at 0.6700.
Though, pair’s downside beneath 0.6700 might not refrain from visiting 0.6650, 61.8% Fibonacci retracement level near 0.6630 and 0.6610 consecutive rest-points.
Alternatively, a sustained break of 0.6800 can escalate the recovery to 50-day SMA level of 0.6830 ahead of visiting 23.6% Fibonacci retracement near 0.6840.
During the pair’s extended rise past-0.6840, 0.6870, 0.6900 and a downward sloping trend-line since December, at 0.6915, seem crucial to watch.
Assuming bulls’ dominance past-0.6915, 0.6940 and 0.6970 can become their favorites.
NZD/USD daily chart
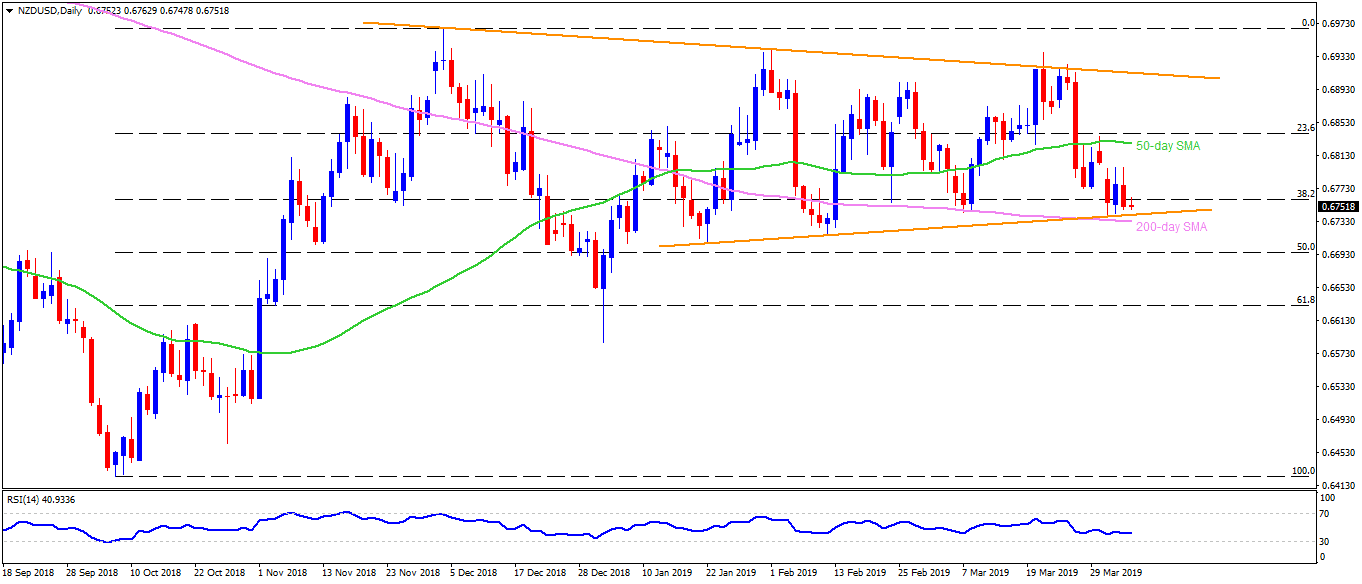
Trend: Negative
