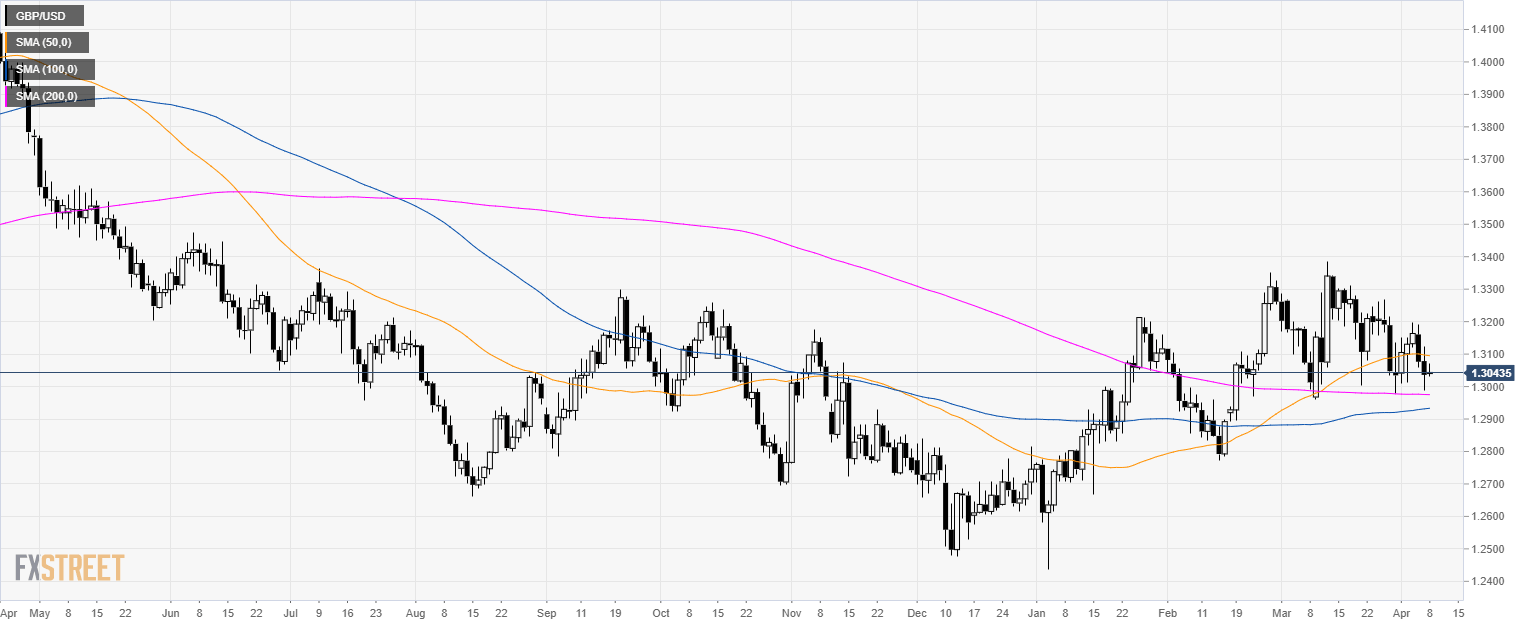
Home GBP/USD Technical Analysis: Cable is weak near 1.3040 level
FXStreet News

GBP/USD Technical Analysis: Cable is weak near 1.3040 level

GBP/USD daily chart

  • GBP/USD is consolidating above the 200-day simple moving average (SMA).


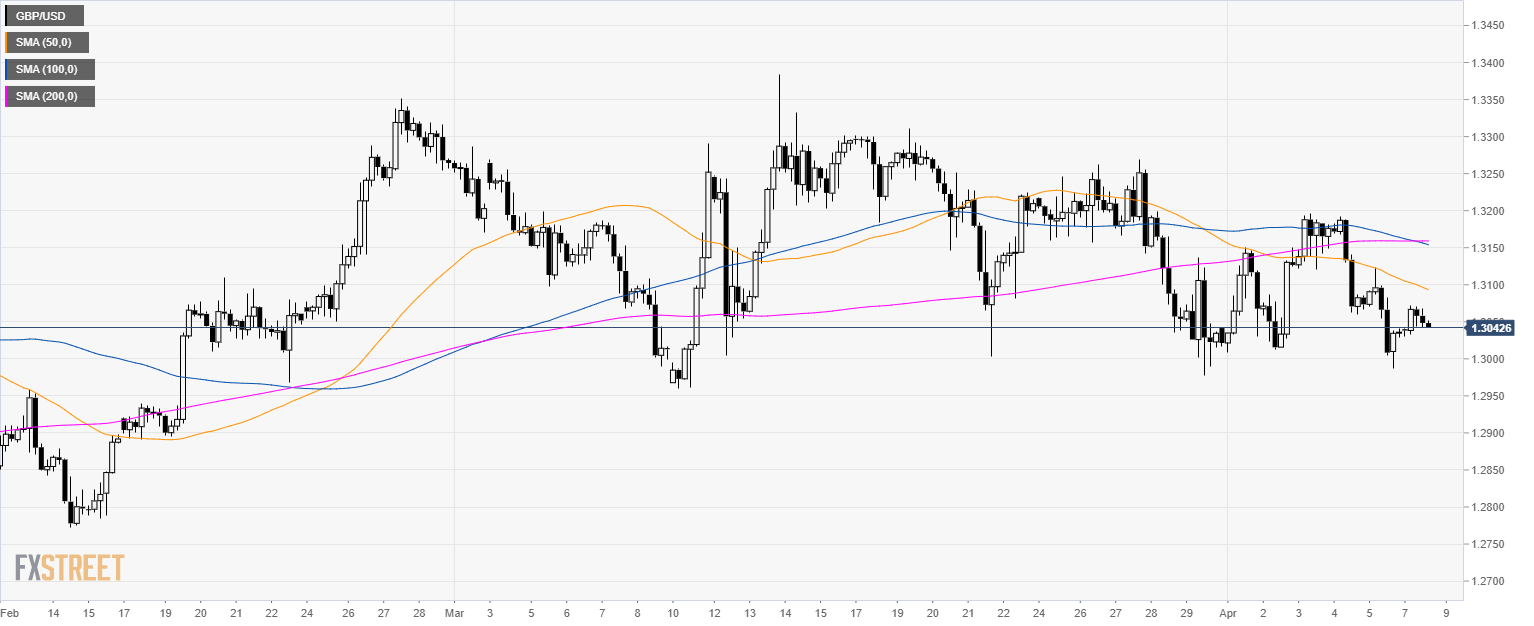
GBP/USD 4-hour chart

  • GBP/USD is trading below its main SMAs suggesting bearish momentum.

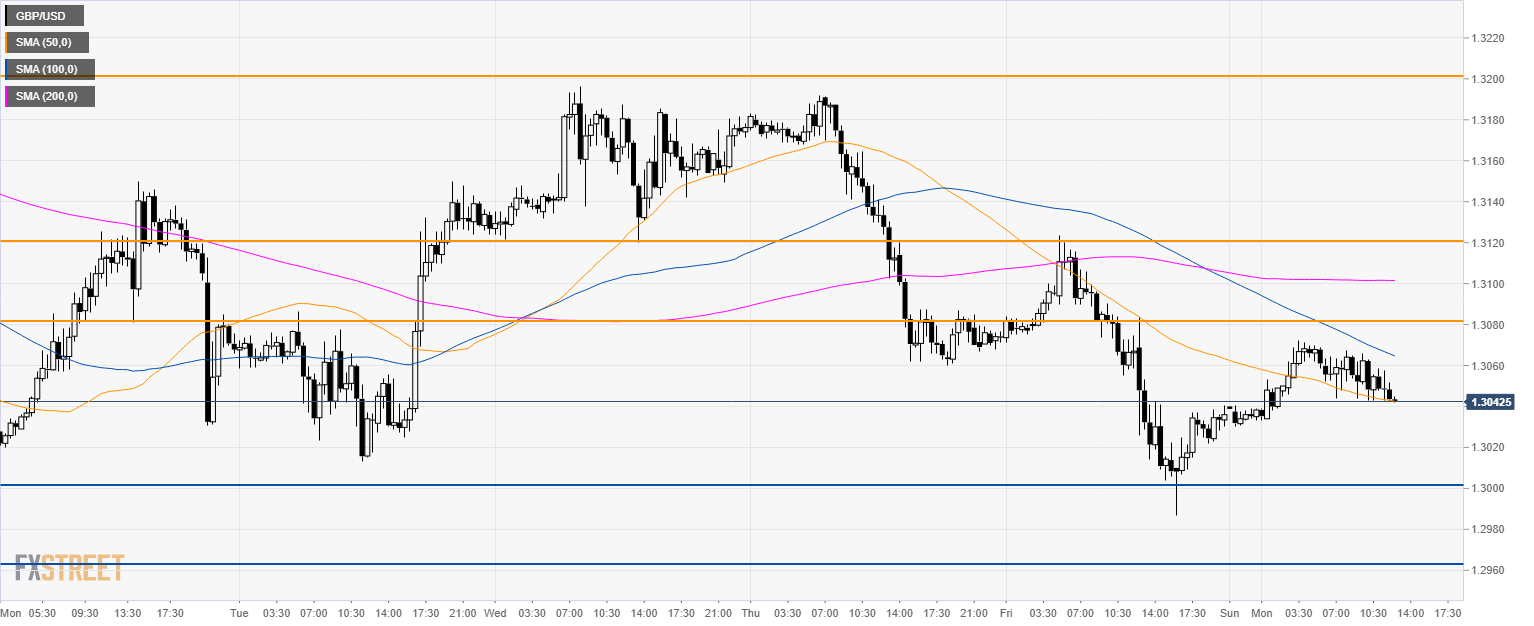
GBP/USD 30-minute chart

  • GBP/USD rejected 1.3080 resistance and the 100 SMA.
  • A bear break below 1.3040 can lead to 1.3000 figure.
  •  To the upside, resistance is at 1.3080, 1.3120 and 1.3200 level.

Additional key levels


FX Street

FX Street

FXStreet is the leading independent portal dedicated to the Foreign Exchange (Forex) market. It was launched in 2000 and the portal has always been proud of their unyielding commitment to provide objective and unbiased information, to enable their users to take better and more confident decisions.