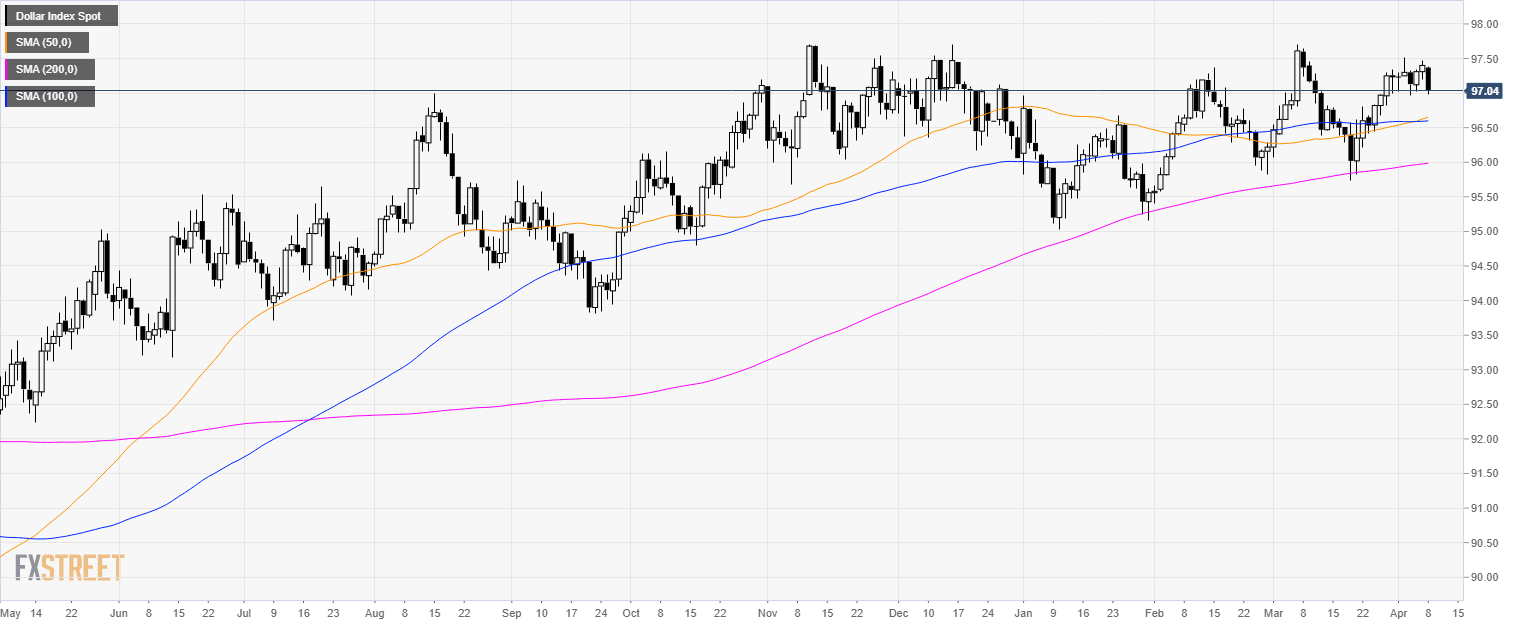
Home US Dollar Index Technical Analysis: DXY is down on Monday to 97.00 key figure
FXStreet News

US Dollar Index Technical Analysis: DXY is down on Monday to 97.00 key figure

DXY daily chart

  • The US Dollar Index (DXY) is trading in a bull trend above its 200-day simple moving average (SMA).
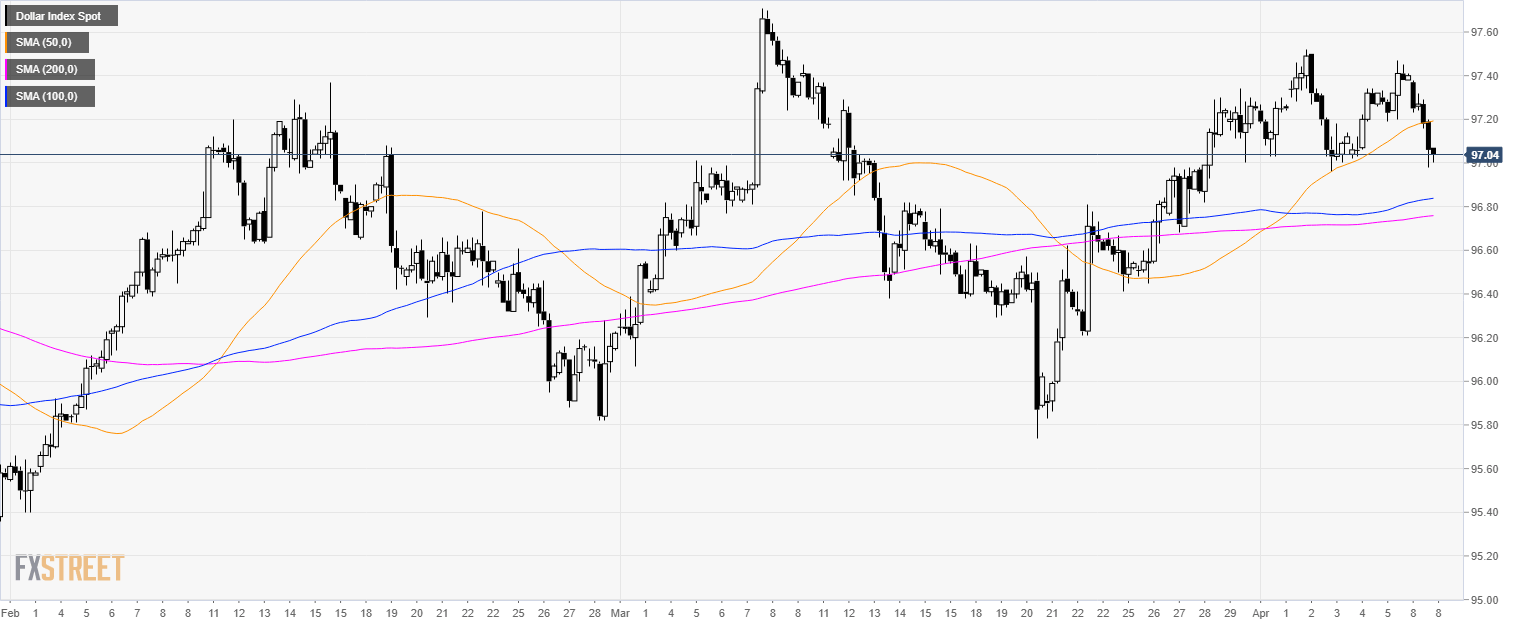
DXY 4-hour chart

  • DXY is trading above is an important support at 97.00 figure.
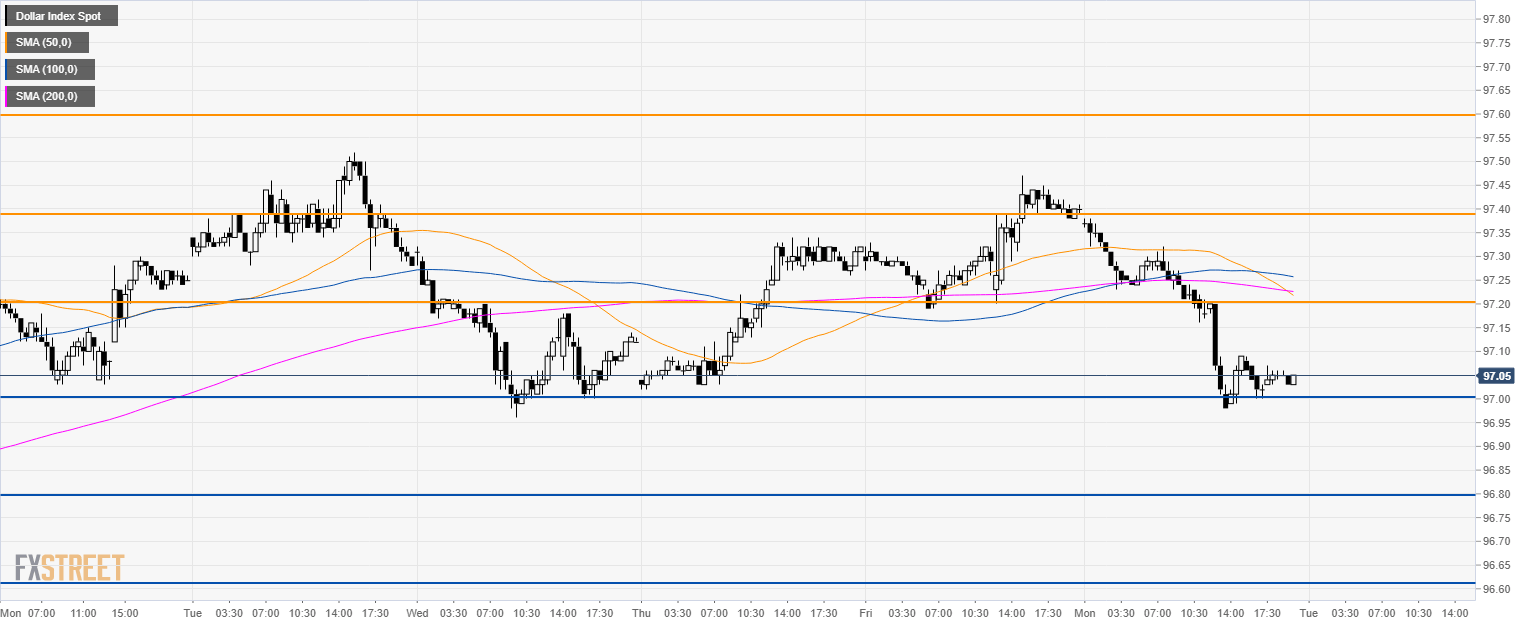
DXY 30-minute chart

  • DXY is trading below its main SMAs suggesting a bearish bias in the short-term.
  • Bears will need to overtake 97.00 key support. A breach below the level can open the doors to 96.80 and 96.60.  
  • On the way up, 97.20 and 97.40 can offer resistance.

Additional key levels


FX Street

FX Street

FXStreet is the leading independent portal dedicated to the Foreign Exchange (Forex) market. It was launched in 2000 and the portal has always been proud of their unyielding commitment to provide objective and unbiased information, to enable their users to take better and more confident decisions.