USD/IDR bounces off the short-term triangle support and 50-day simple moving average (SMA) to around 14,170 during early Monday.
Pair’s recent pullback from important support-confluence signal brighter chances of its U-turn to 23.6% Fibonacci retracement of October 2018 to February 2019 declines, at 14,230 now.
However, 100-day SMA level of 14,260 and the triangle resistance near 14,310 could challenge buyers then after.
In a case, the quote rallies past-14,310, 14,350, 14,420 and 200-day SMA level of 14,510 might appear on the Bulls’ radar.
Alternatively, pair’s decline under 14,110 support-confluence might require sustained downturn under 14,100 to aim for February 25 lows near 13,940.
Also, pair’s additional south-run beneath 13,940 can well recall February month lows near 13,890.
USD/IDR daily chart
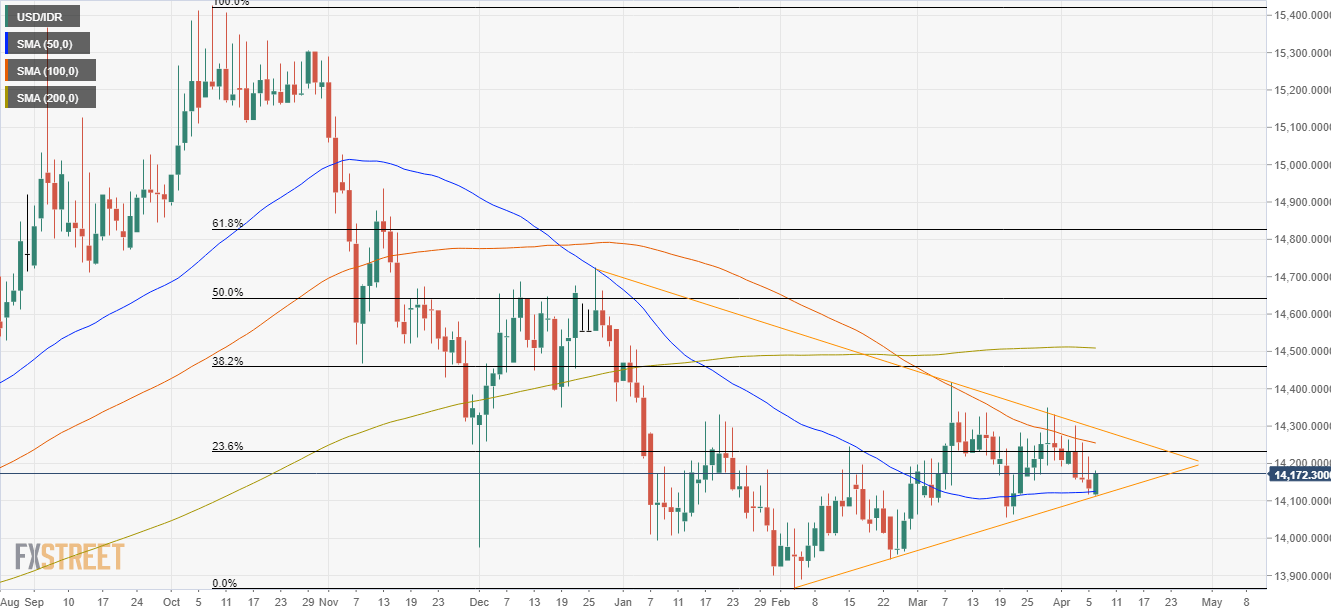
Trend: Mild recovery expected
