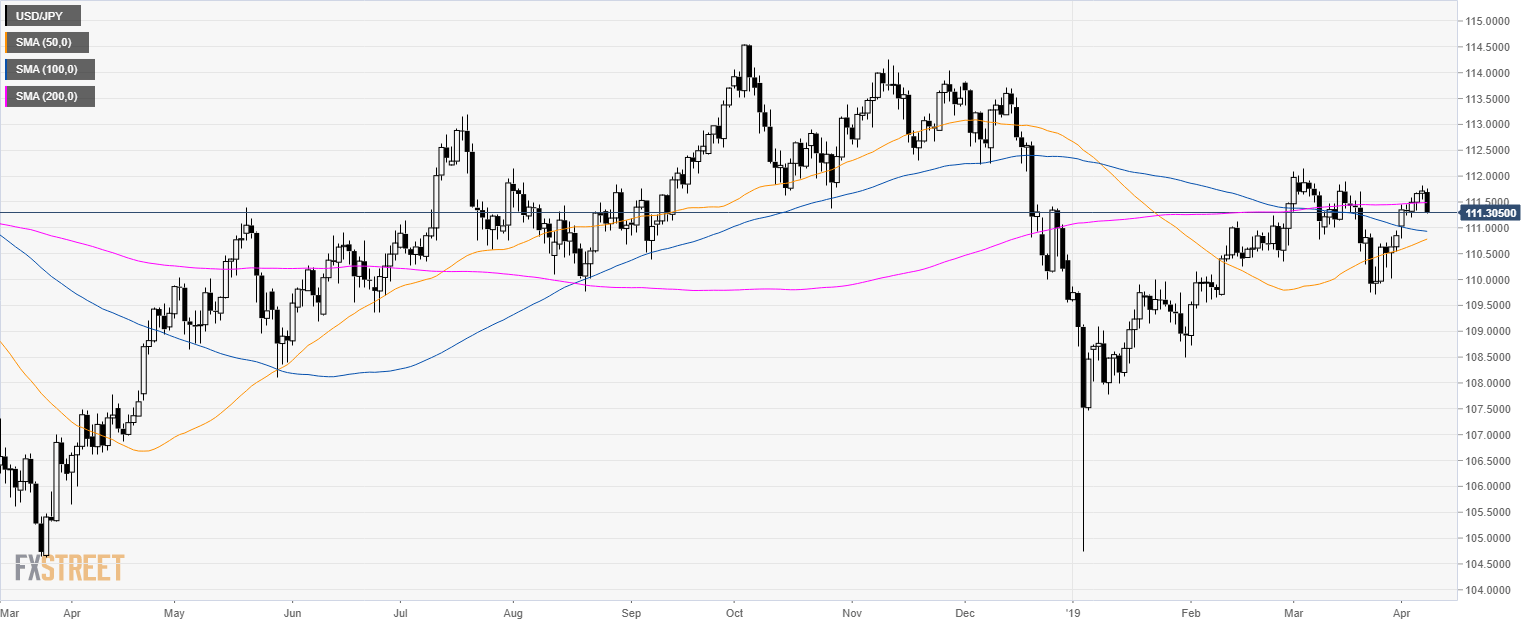
Home USD/JPY Technical Analysis: Greenback on the back foot trading sub-110.50 level
FXStreet News

USD/JPY Technical Analysis: Greenback on the back foot trading sub-110.50 level

USD/JPY daily chart

  • USD/JPY is consolidating below its 200-day simple moving average (SMA).


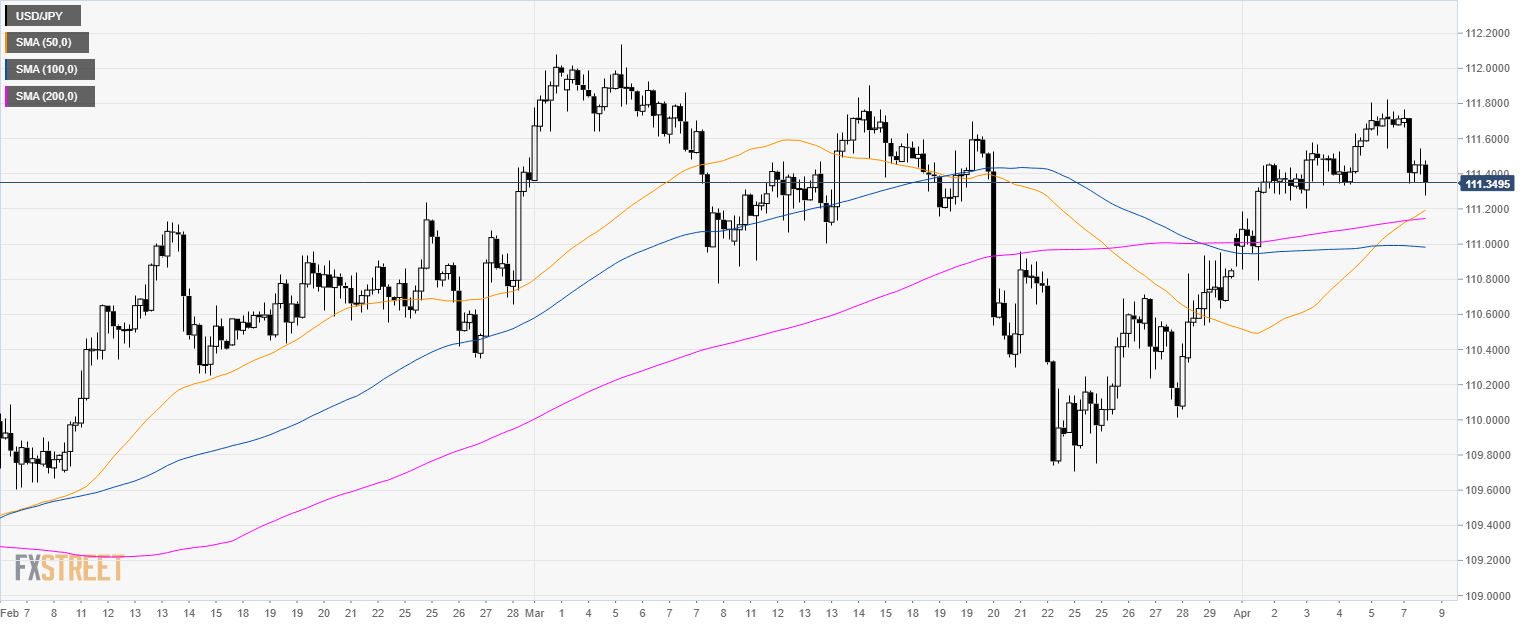
USD/JPY 4-hour chart

  • USD/JPY is trading above its main SMAs suggesting a bullish bias in the medium-term.


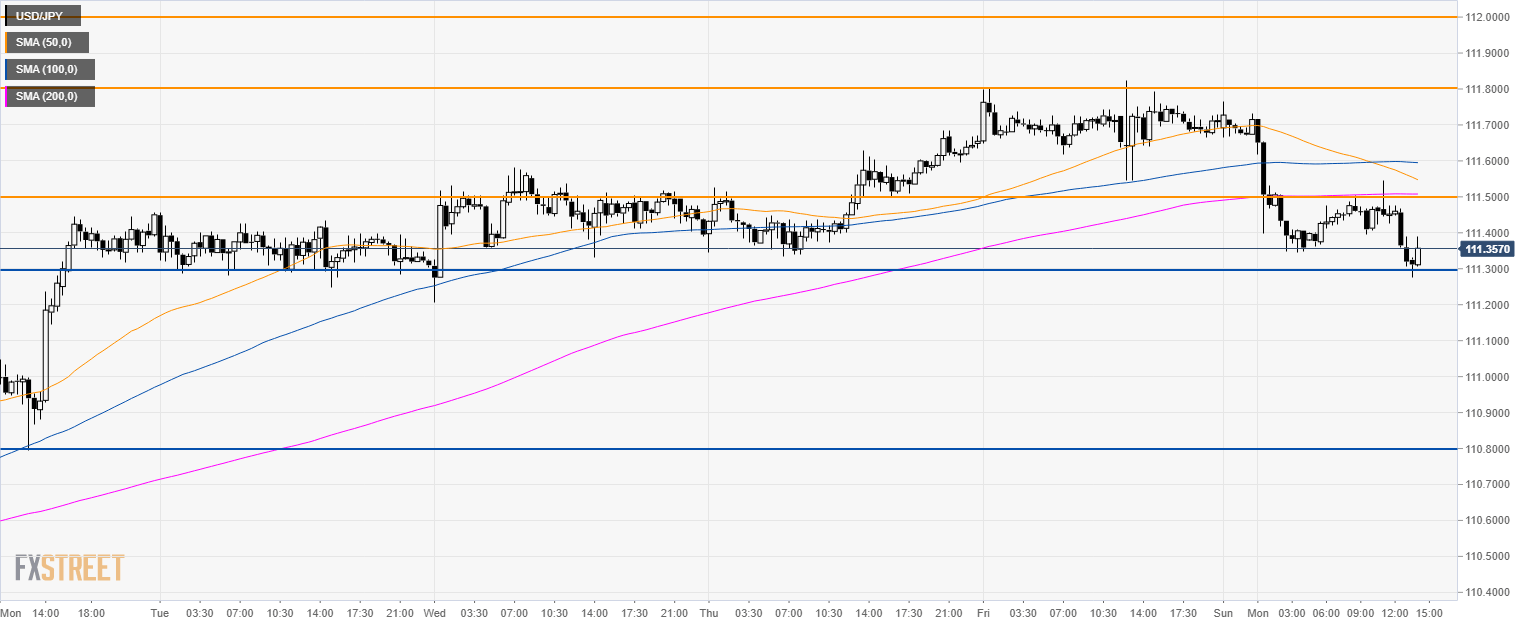
USD/JPY 30-minute chart

  • USD/JPY is trading below its main SMA suggesting bearish momentum in the short-term.
  • Bears are pressuring the daily lows and they need to break below 111.30 to reach 110.80 key support.
  • Looking up, resistance can be expected at 111.50 and 111.80 level.

Additional key levels


FX Street

FX Street

FXStreet is the leading independent portal dedicated to the Foreign Exchange (Forex) market. It was launched in 2000 and the portal has always been proud of their unyielding commitment to provide objective and unbiased information, to enable their users to take better and more confident decisions.