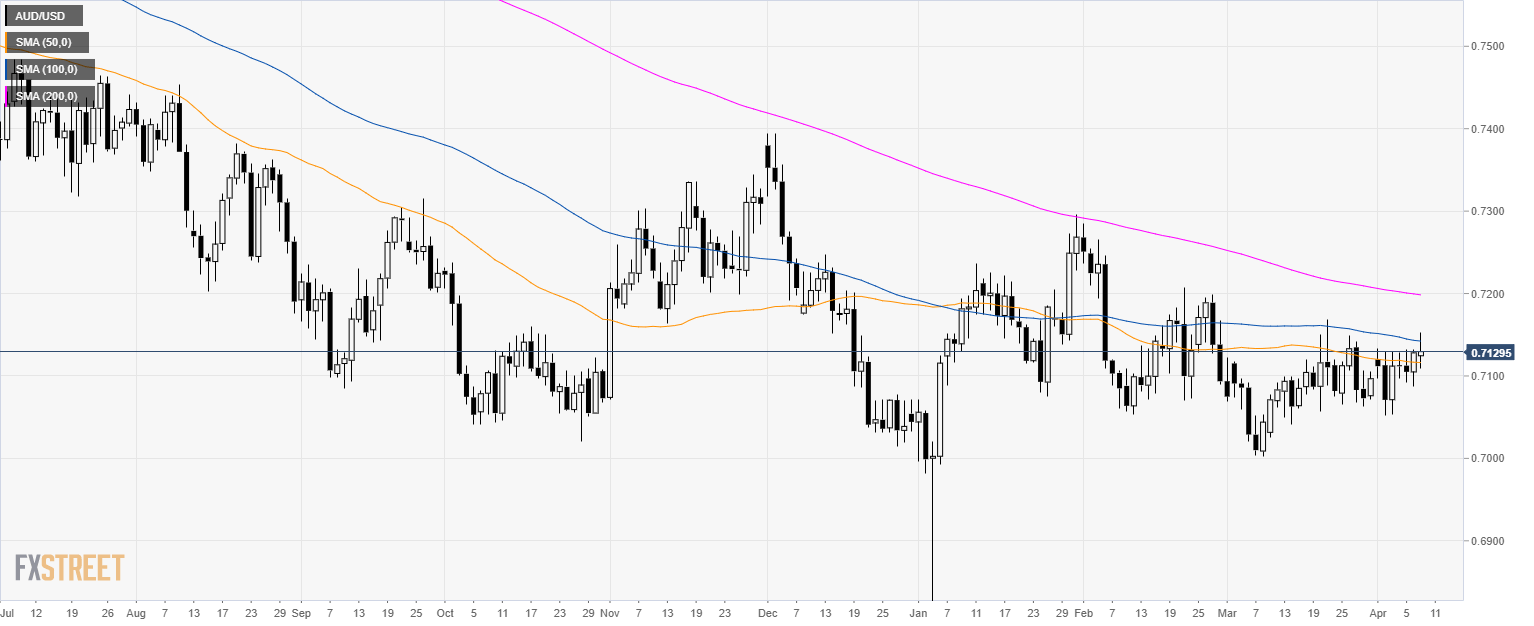
AUD/USD daily chart
- AUD/USD is trading in a bear trend below its 200-day simple moving averages (SMA).
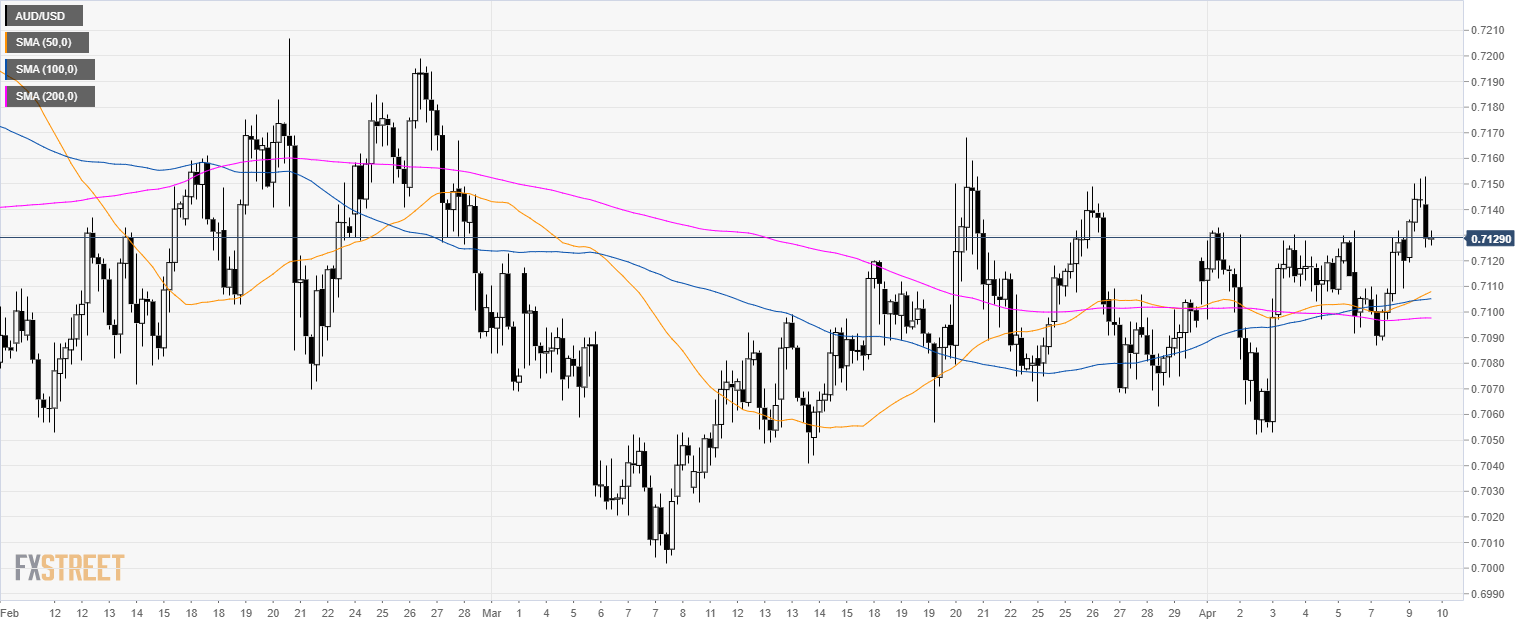
AUD/USD 4-hour chart
- AUD/USD is trading above its main SMAs suggesting a bullish bias in the medium-term.
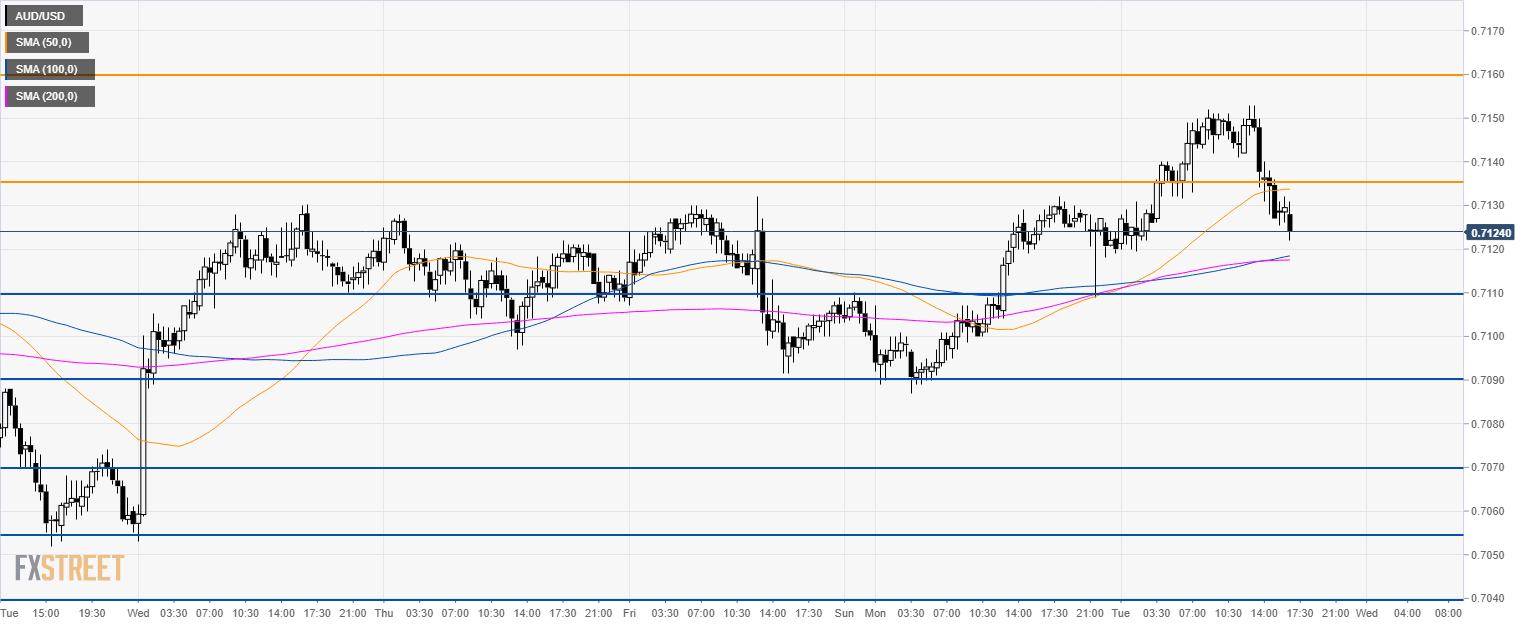
AUD/USD 30-minute chart
- AUD/USD didn’t find acceptance above the 0.7160 resistance as the bears are bringing the market below the 50 SMA.
- It is a mixed picture for the pair however, bears seem to have gathered more conviction and a move towards 0.7110 and 0.7090 can well be on the cards.
- Resistances are located at 0.7135 and 0.7160 level.
Additional key levels
