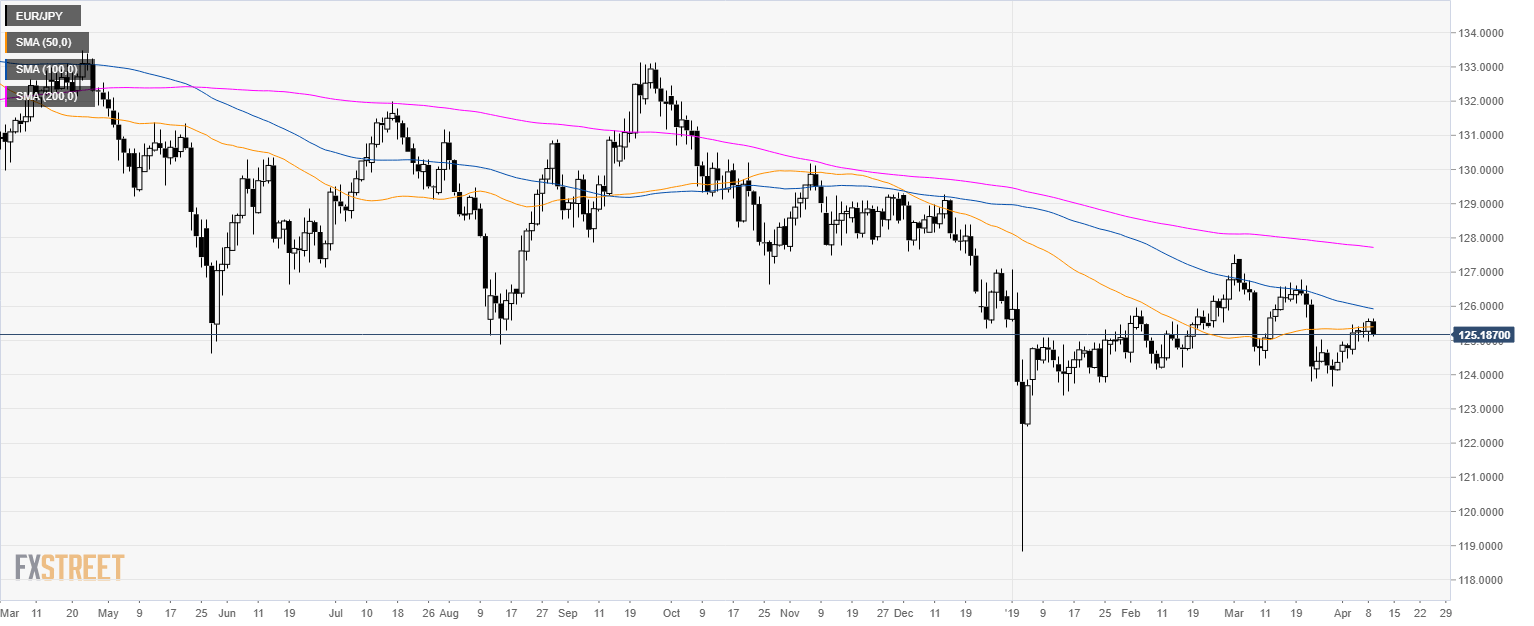
EUR/JPY daily chart
- EUR/JPY is trading in a bear trend below its main simple moving average (SMA).
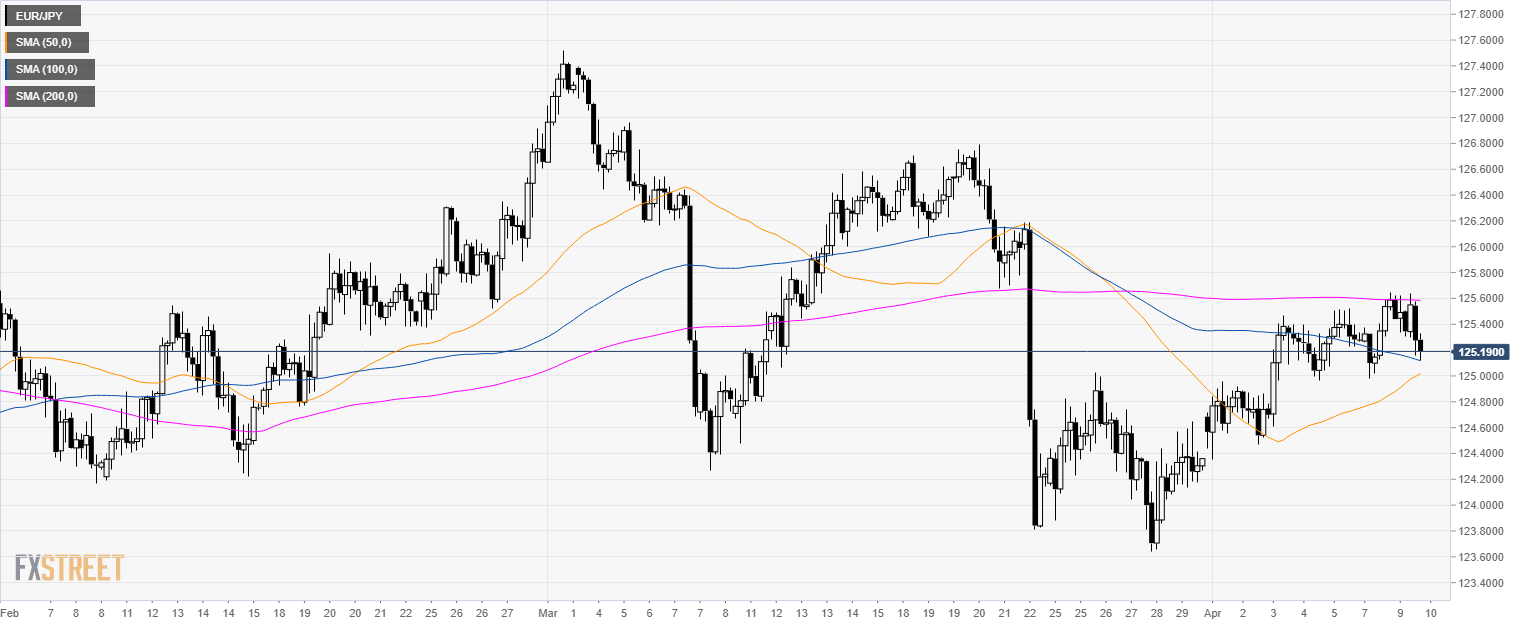
EUR/JPY 4-hour chart
- EUR/JPY is trading below its 200 SMA suggesting a bearish bias in the medium-term.
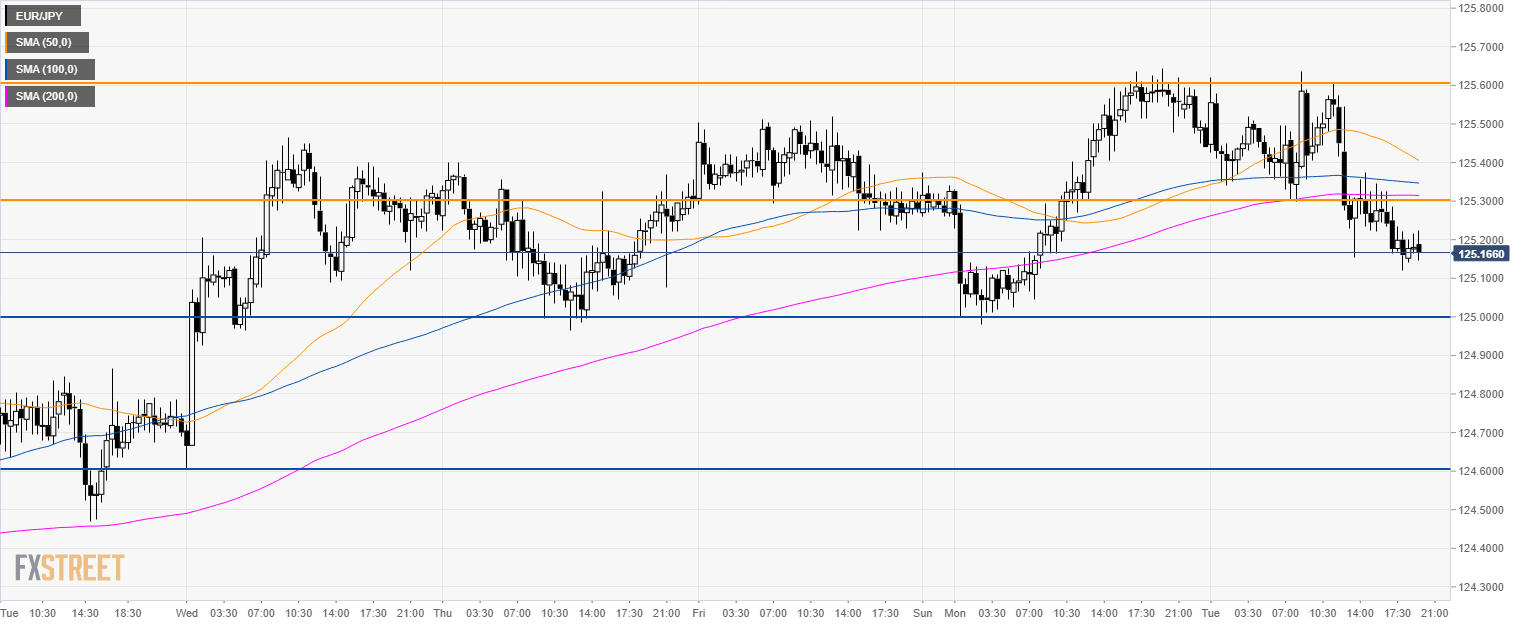
EUR/JPY 30-minute chart
- The market rejected 125.60 resistance as the market is trading below its main SMAs.
- The key support for bears is at 125.00 level. If they gather enough strength to break below it the next support in line is lileky located near 124.60 level.
- On the way up, initial resistance is seen at 125.30 and 125.60 level.
Additional key levels
