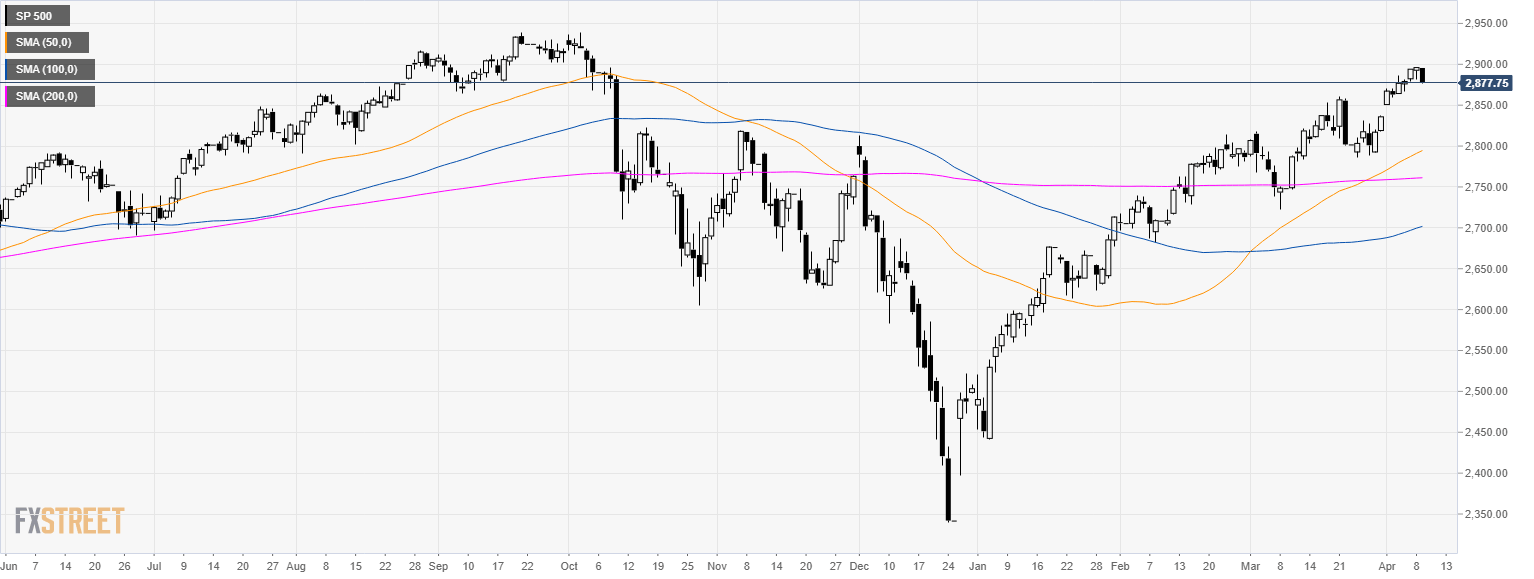
S&P500 daily chart
- The S&P500 index is trading above its main simple moving averages (SMAs) suggesting bullish momentum.
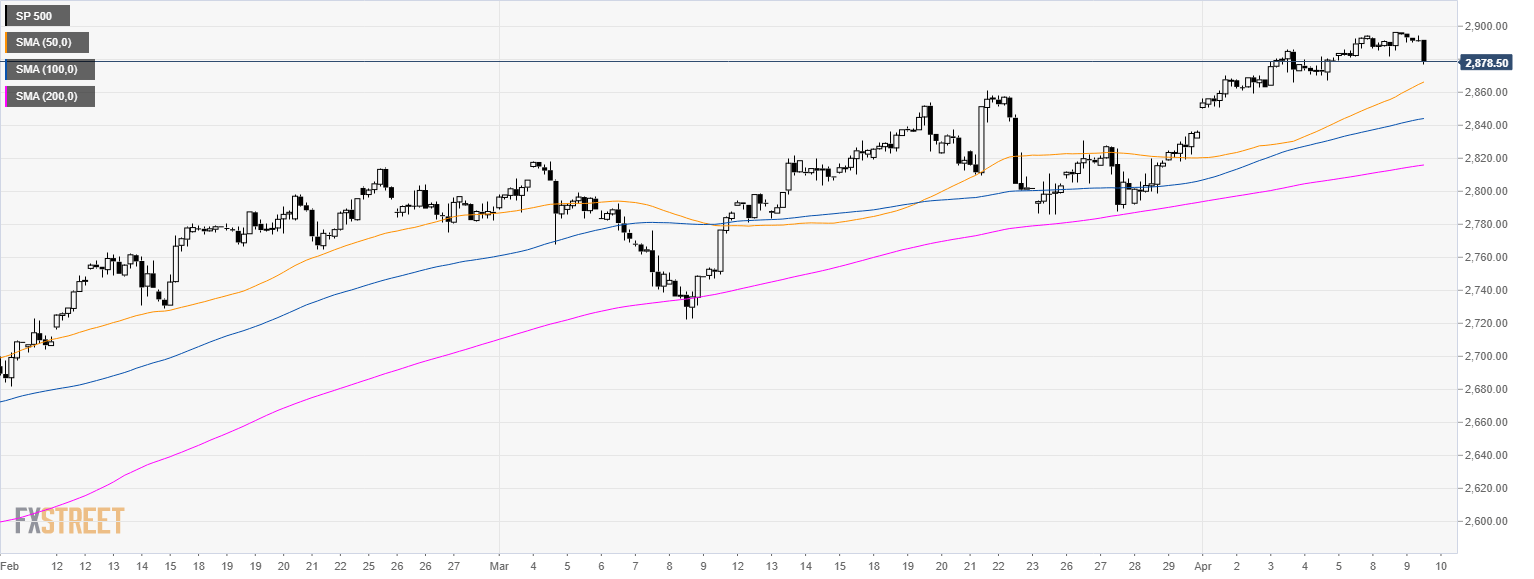
S&P500 4-hour chart
- The S&P500 is trading above its main SMAs suggesting a bullish bias in the medium-term.
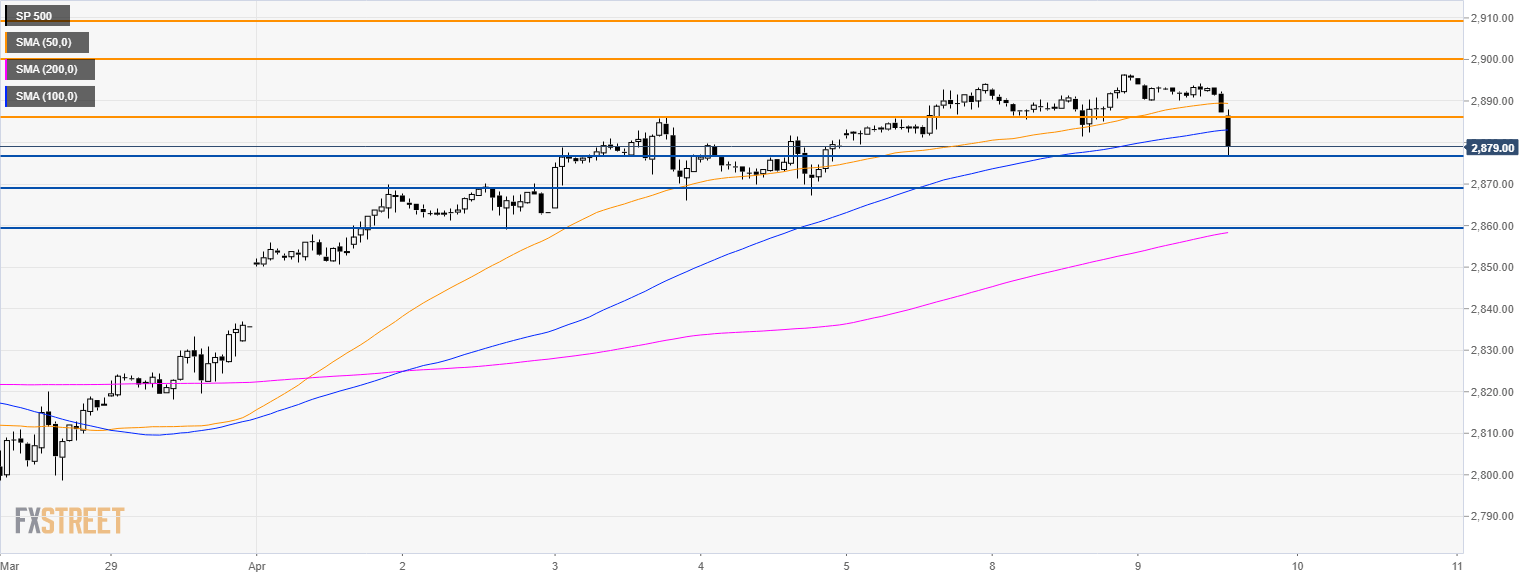
S&P500 60-minute chart
- The S&P500 is dropping below 2,886.00 support and the 100 SMA. The overall trend is still bullish and bears would need to overcome 2,877.00 support to continue the recent move down.
- Support is at 2,870.00 and 2,860.00 level.
- To the upside, resistance is at 2886.00 and 2,900.00 resistance.
Additional key levels
