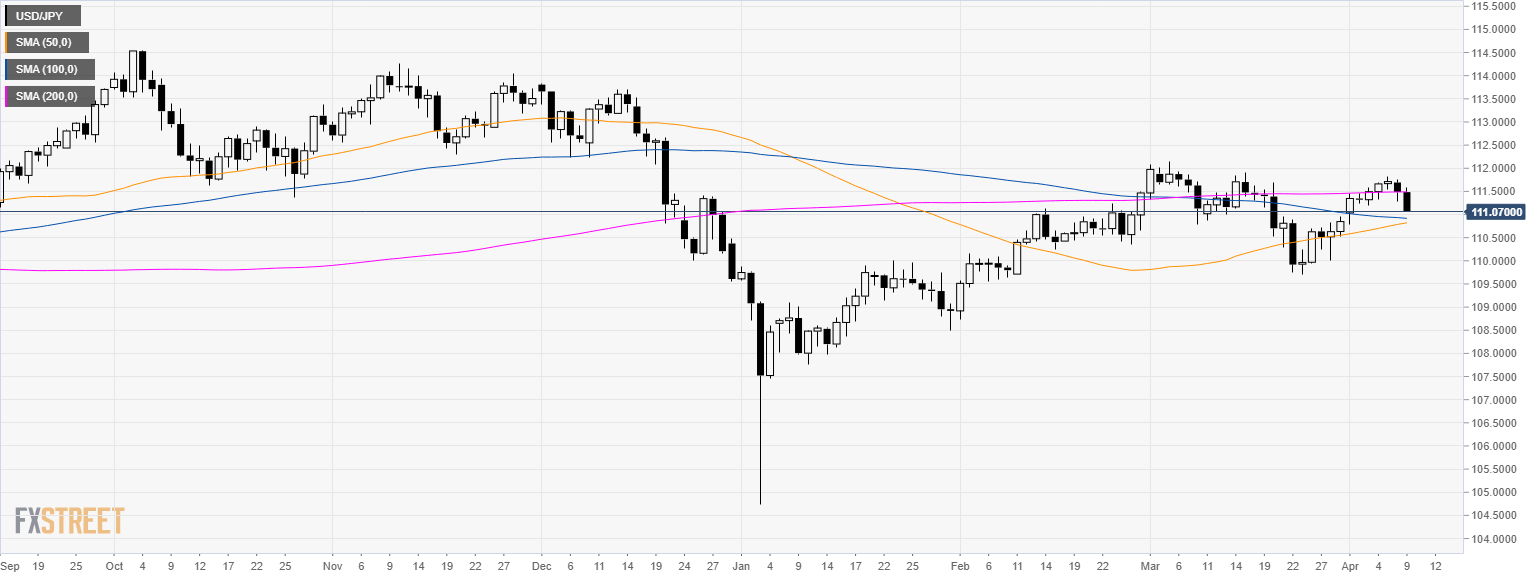
Home USD/JPY Technical Analysis: Greenback dropping to daily lows and approaching 110.00 figure
FXStreet News

USD/JPY Technical Analysis: Greenback dropping to daily lows and approaching 110.00 figure

USD/JPY daily chart

  • USD/JPY is declining below its 200-day simple moving average (SMA).

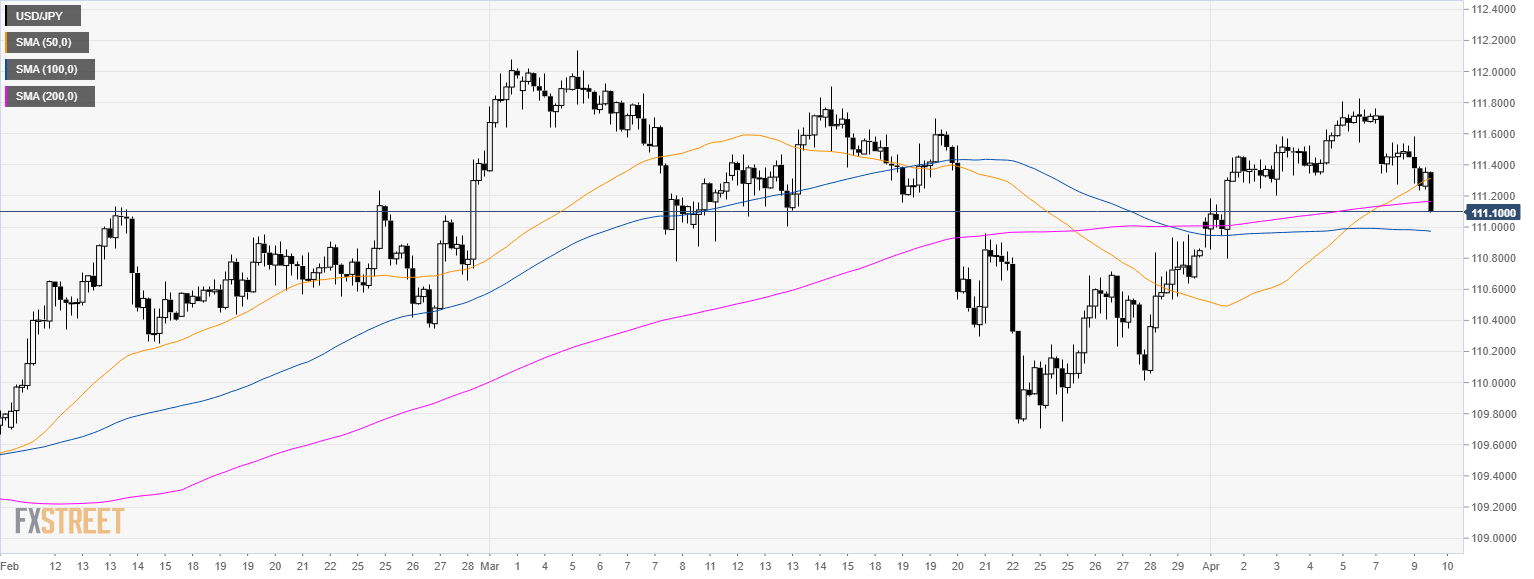
USD/JPY 4-hour chart

  • USD/JPY is trading below its 200 SMA suggesting a bearish bias in the medium-term.

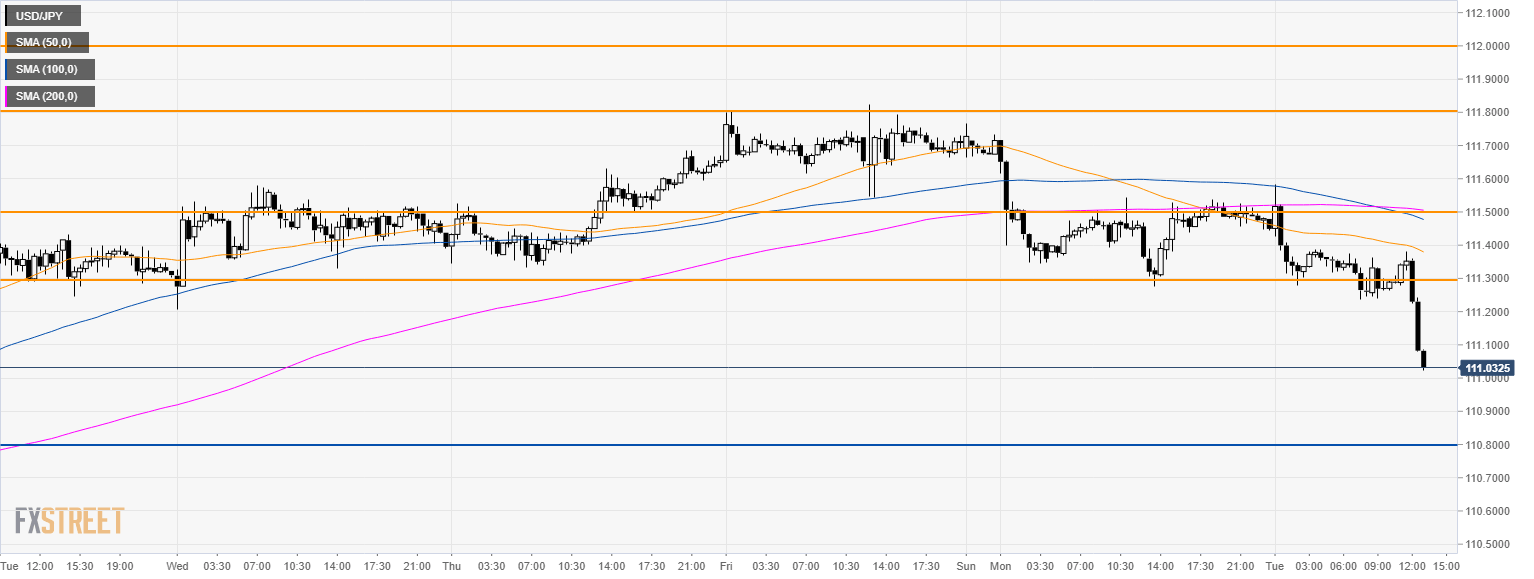
USD/JPY 30-minute chart

  • USD/JPY broke below the 111.30 support as the market is trading below its main SMAs.
  • Bears are in a favorable  position to target 110.80 key support.
  • Looking up, resistance is seen at 111.30 and 111.50 level.


Additional key levels


FX Street

FX Street

FXStreet is the leading independent portal dedicated to the Foreign Exchange (Forex) market. It was launched in 2000 and the portal has always been proud of their unyielding commitment to provide objective and unbiased information, to enable their users to take better and more confident decisions.