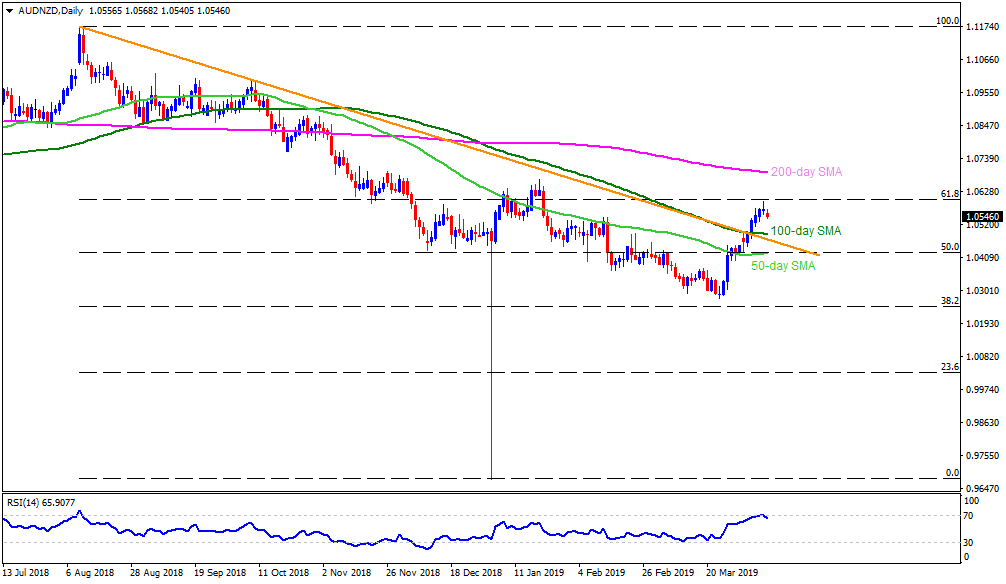
AUD/NZD daily chart
- AUD/NZD portrays pullback from 61.8% Fibonacci retracement of its August 2018 to January 2019 downturn as it presently trades near 1.0550 during early Wednesday.
- 100-day simple moving average (SMA) near 1.0490 and a descending trend-line stretched since August 2018 at 1.460 could become import supports ahead of diverting bears to 1.0430/25 support-confluence including 50% Fibonacci retracement and 50-day SMA.
- Alternatively, a successful break of 61.8% Fibonacci retracement level near 1.0600 enables the buyers to aim for 2019 high near 1.0670 and then confront 200-day SMA level around 1.0695/1.0700.
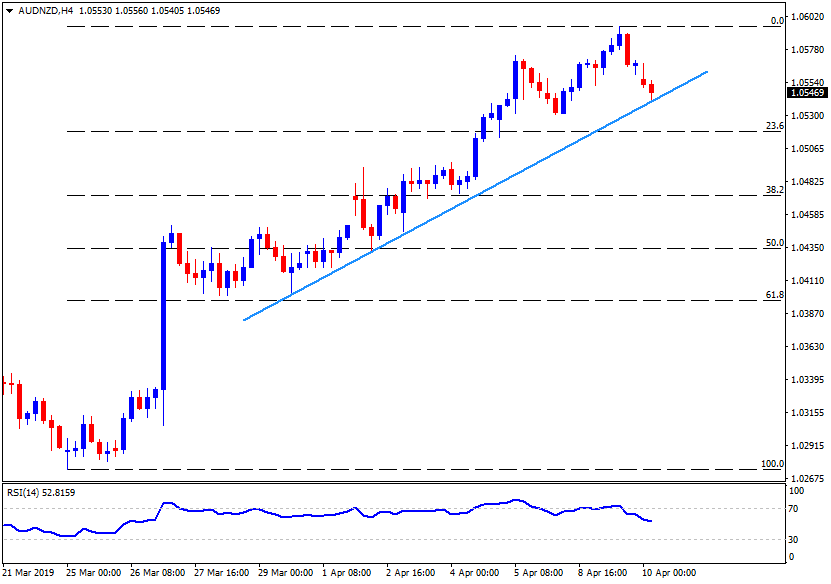
AUD/NZD 4-Hour chart
- Two-week-old ascending trend-line at 1.0540 becomes the closest support, a break of which can recall 1.0530 and 1.0490 on the chart.
- 1.0570 seems adjacent resistance to watch prior to looking at the 1.0600 upside barrier.
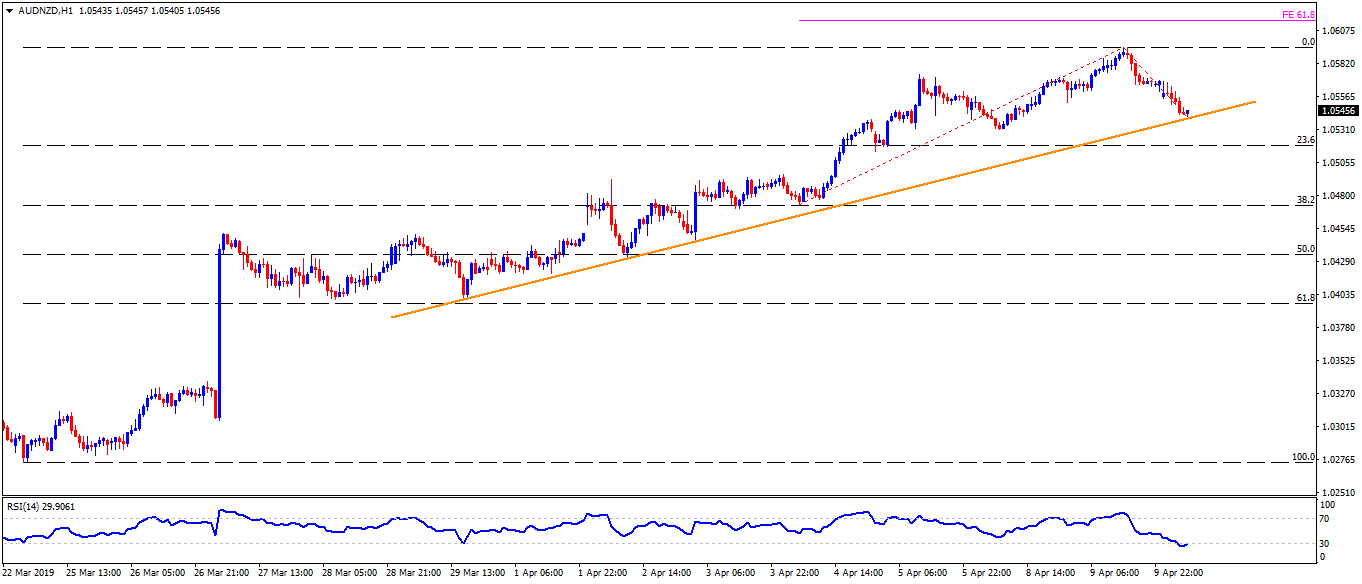
AUD/NZD hourly chart
- 61.8% Fibonacci expansion (FE) level of its current month moves near 1.0615 could provide a buffer stops between 1.0600 and 1.0670.
- 61.8% Fibonacci retracement of its March 25 to April 09 advances, at 1.0400, might become additional support to observe past-1.0425.