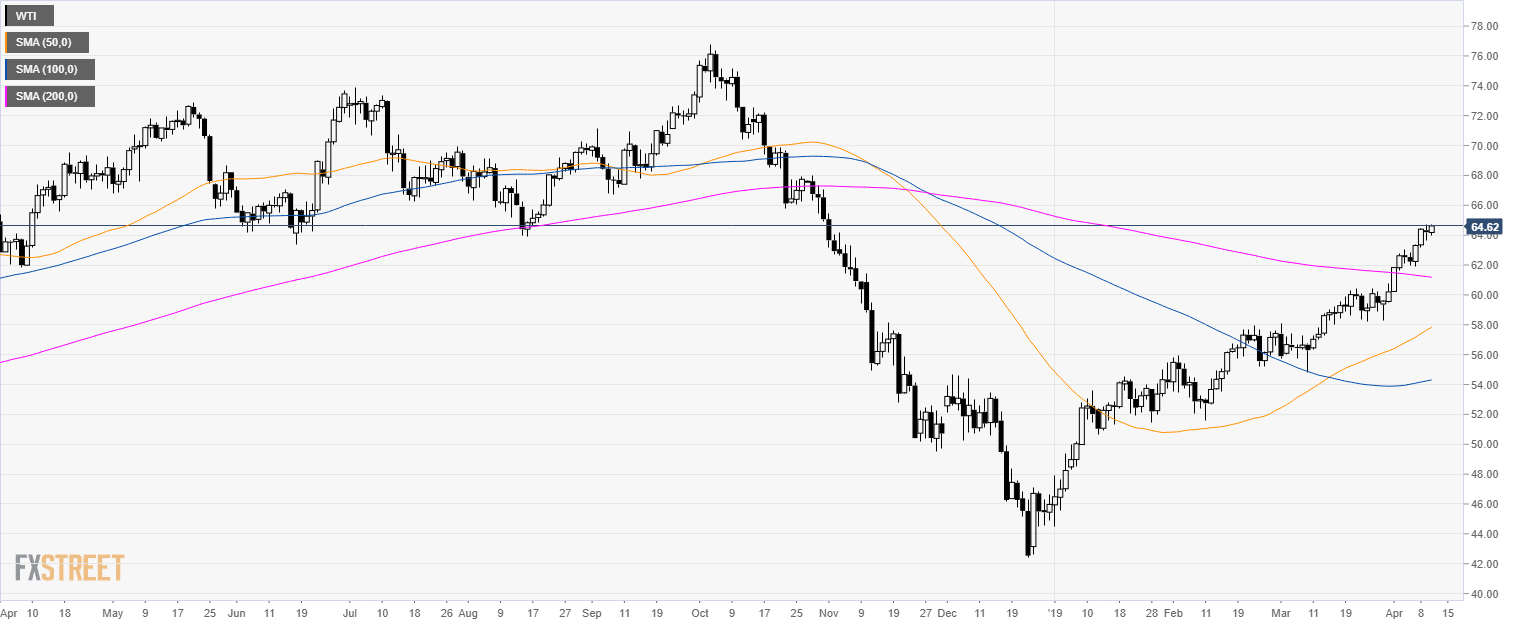
Oil daily chart
- WTI is trading above its main simple moving averages (SMA) suggesting a bullish bias.
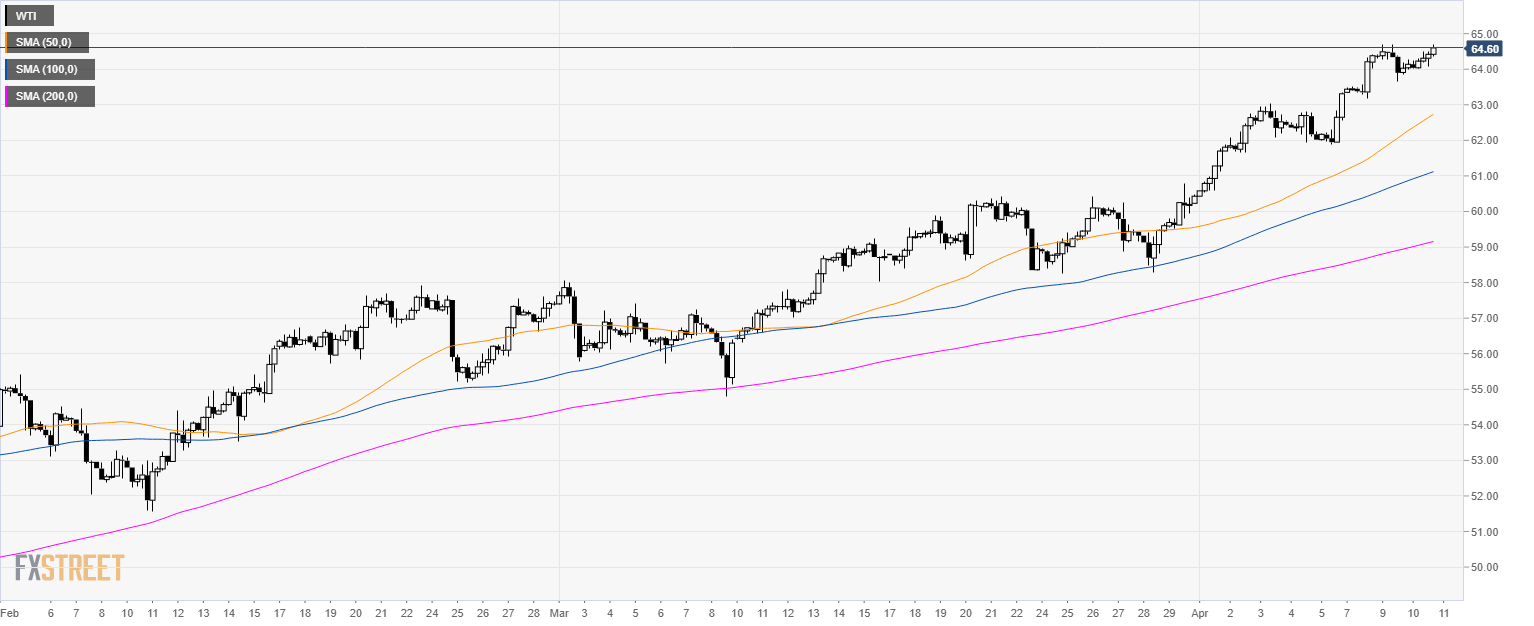
Oil 4-hour chart
- Crude oil WTI is trading above its main SMAs suggesting a bullish bias in the medium-term.
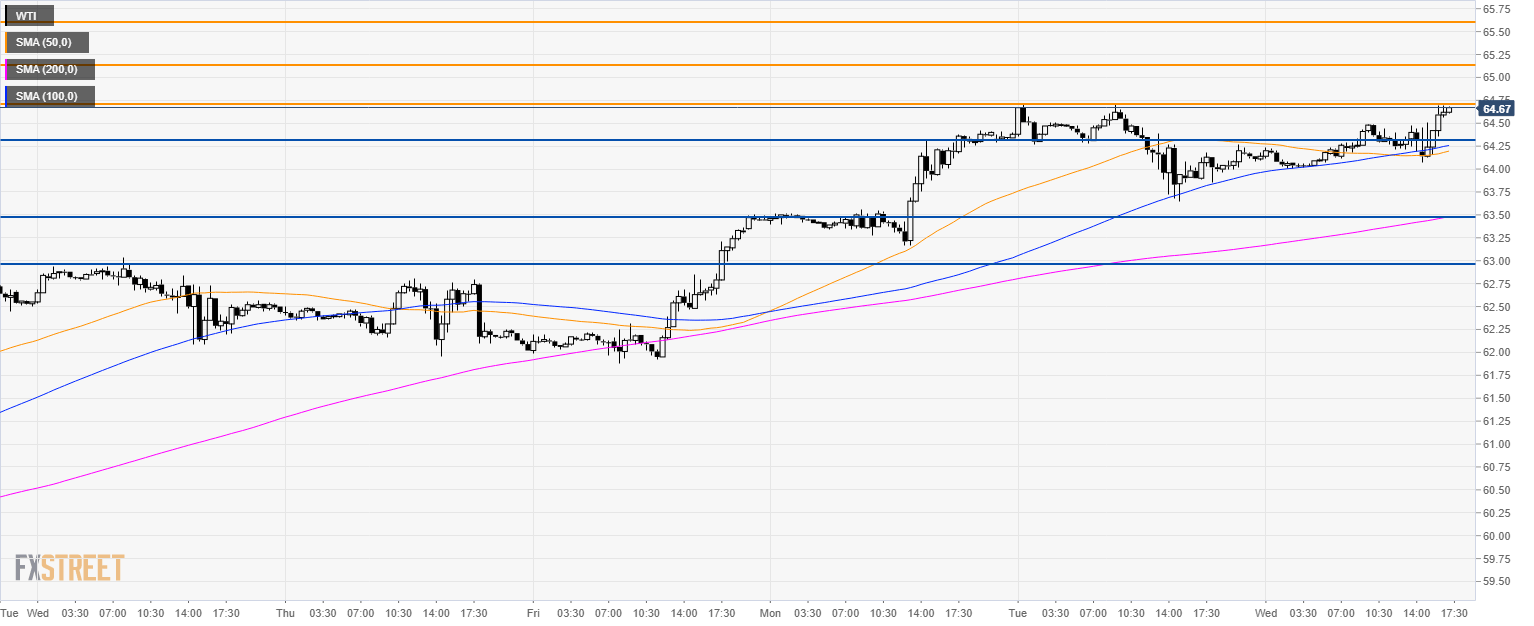
Oil 30-minute chart
- WTI is trading above its main SMAs as the bull trend remains intact.
- The level to beat for bulls is 64.70 followed by 65.10 and 65.60 level.
- To the downside, support is seen at 64.30, 63.50 and 63.00 level.
Additional key levels
