AUD/JPY trades near 79.60 during the early Asian session on Thursday. The pair revisited the multiple-tops marked since April 05 after China’s inflation data flashed mixed results.
If at all present optimism surrounding Australian Dollar (AUD) manage to clear 79.65 upside barrier, 61.8% Fibonacci expansion (FE) of its March 29 April 08 moves, at 79.75, followed by 80.00 could offer intermediate halts during the pair’s theoretical rise towards 80.30. The 200-day simple moving average (SMA) level on the daily chart also validates the importance of 80.30 figure as a strong upside resistance past-79.65.
Given the pair’s sustained increase above 80.30, 80.65/70 area comprising December 2018 lows and 81.00 round-figure might flash on the Bulls’ radar.
Alternatively, nearly ascending trend-line at 79.35, followed by a week-long upward sloping support-line at 79.10, could restrict the pair’s short-term declines.
If prices slide beneath 79.10, ascending triangle break can be confirmed which in turn signal the quote’s further south-run to 78.70 and 78.50 supports.
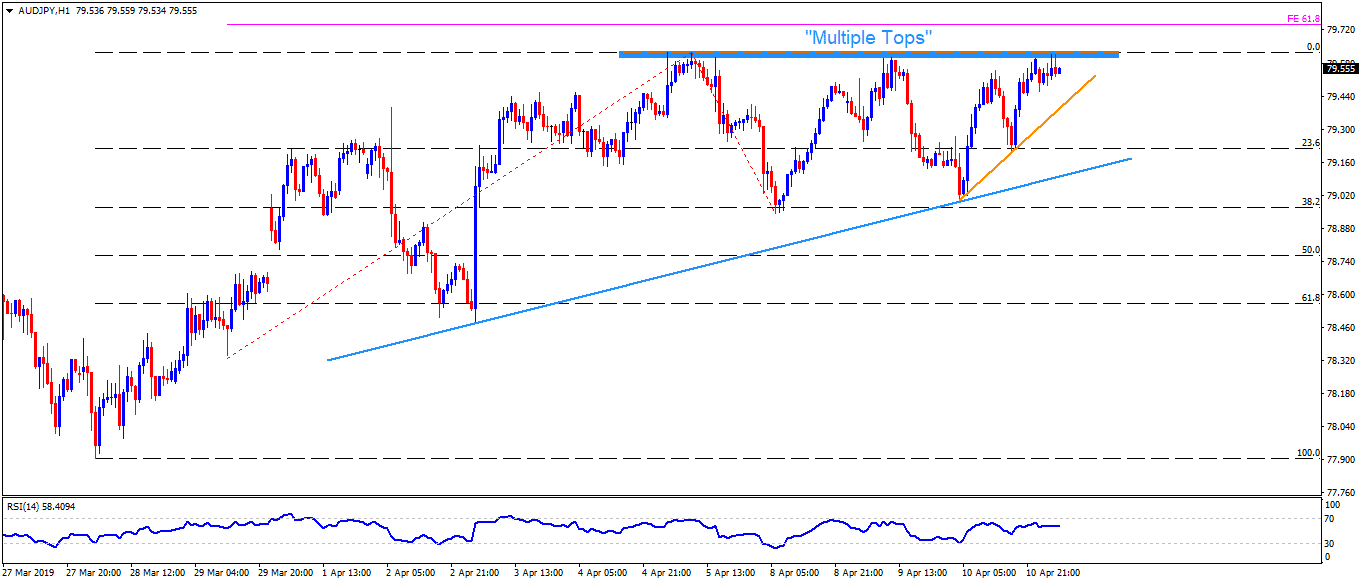
AUD/JPY hourly chart
Trend: Bullish
