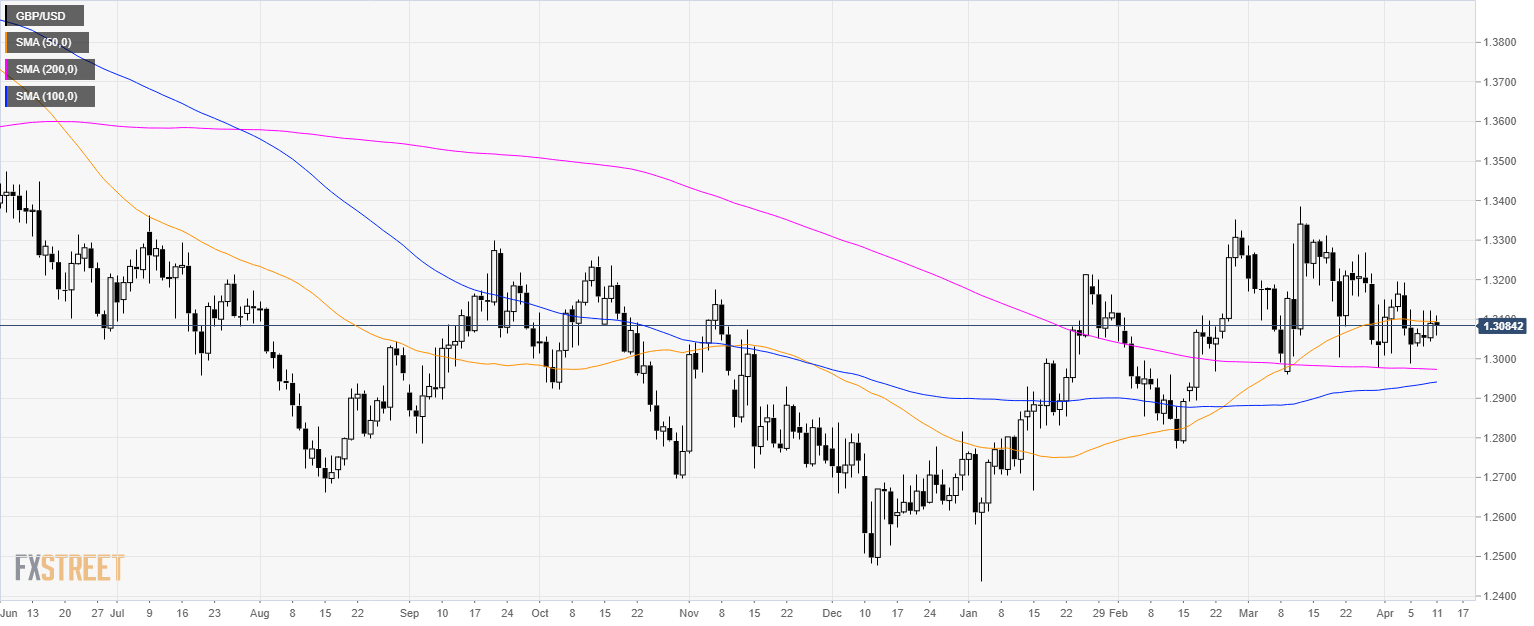
GBP/USD daily chart
- GBP/USD is consolidating above the 200-day simple moving average (SMA).
- GBP/USD is not having a clear direction in the short-term.
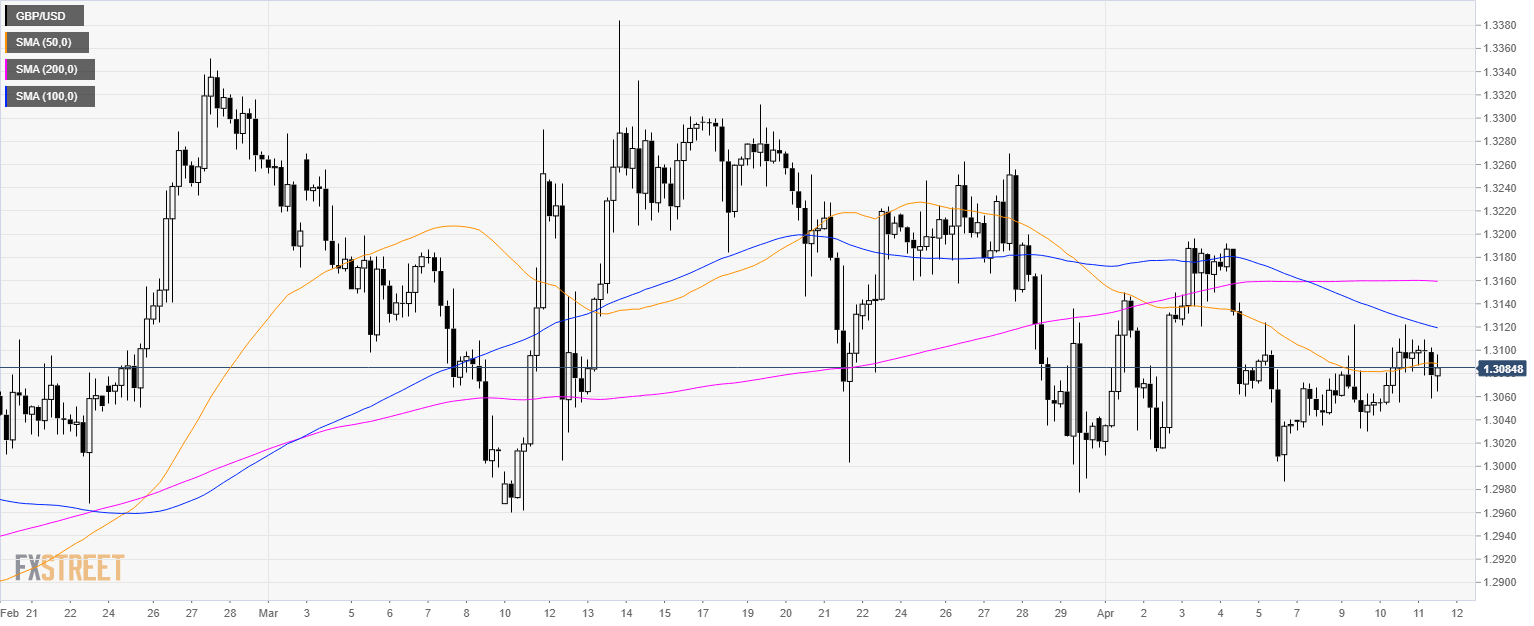
GBP/USD 4-hour chart
- GBP/USD is trading near the 50 SMA.
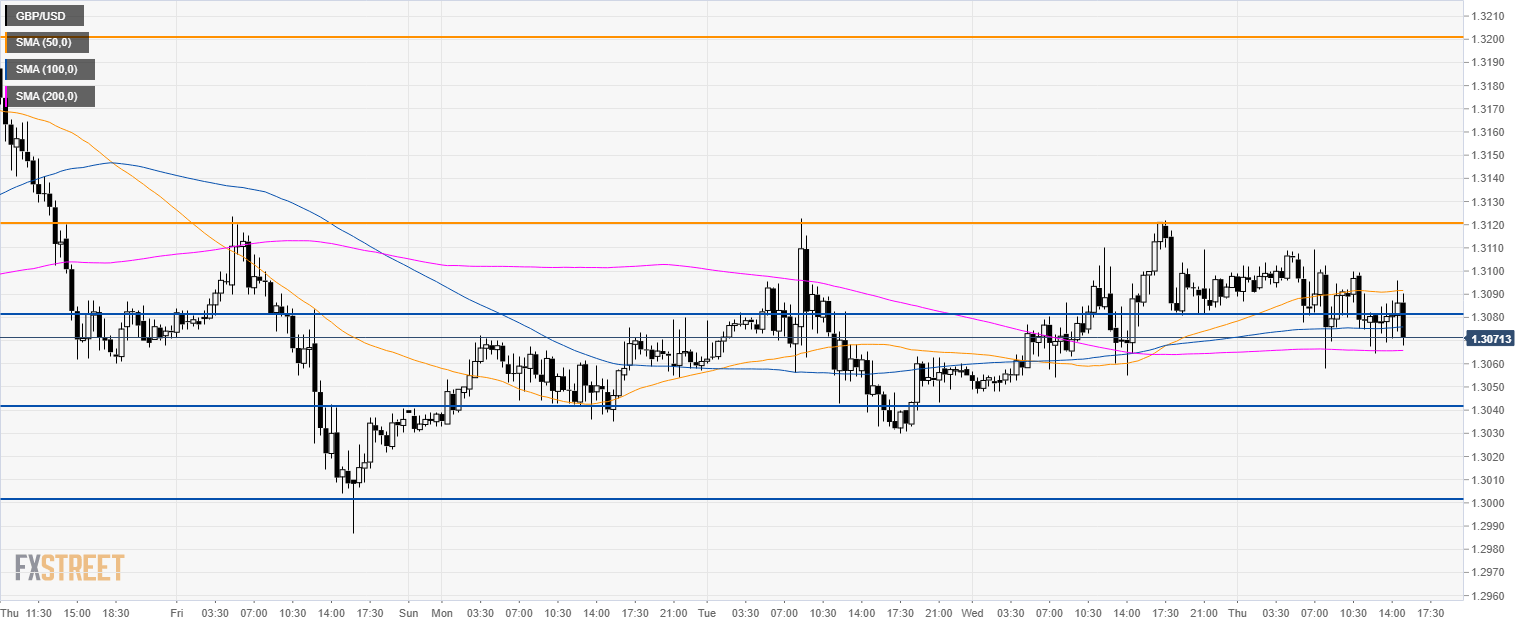
GBP/USD 30-minute chart
- GBP/USD remains stuck in a range.
- Buyers will need to break above 1.3200 to reach 1.3250 resistance.
- On the flip side, 1.3040 and 1.3000 level can act as a level of support.
Additional key levels
