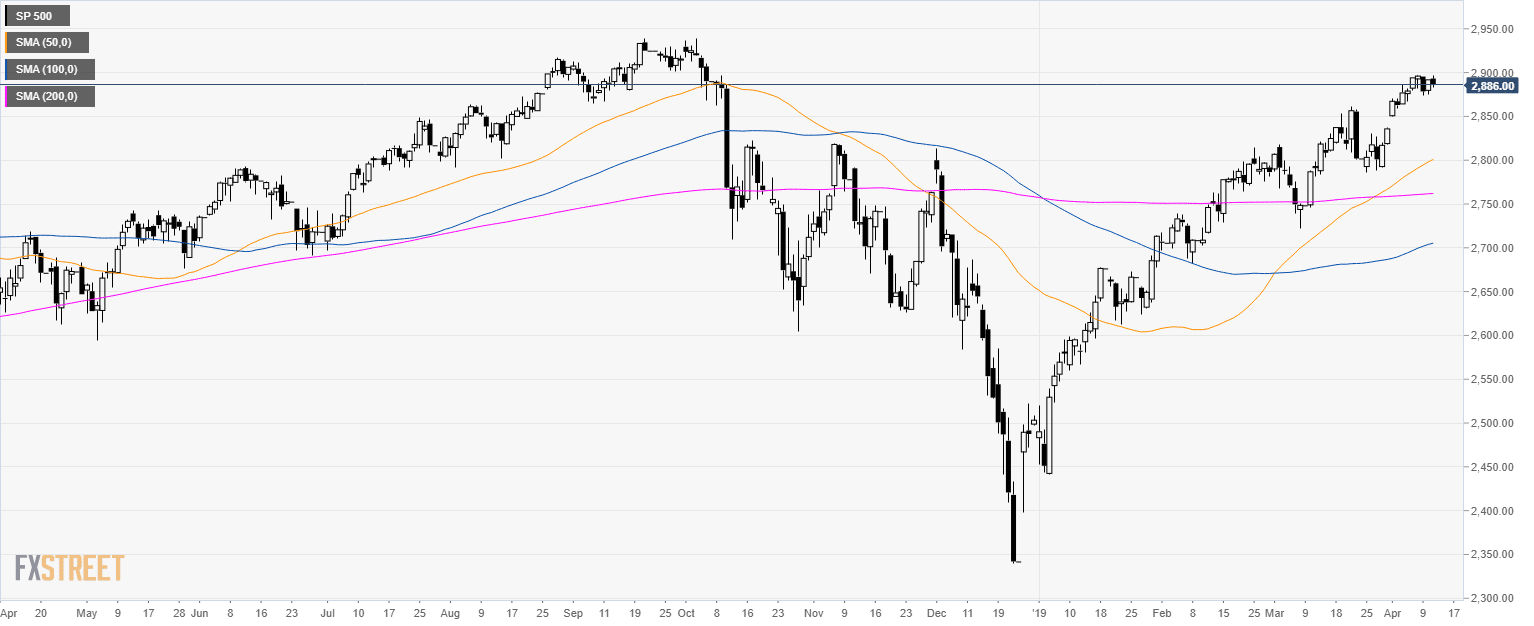
S&P500 daily chart
- The S&P500 index is trading above its main simple moving averages (SMAs) suggesting a bullish momentum.
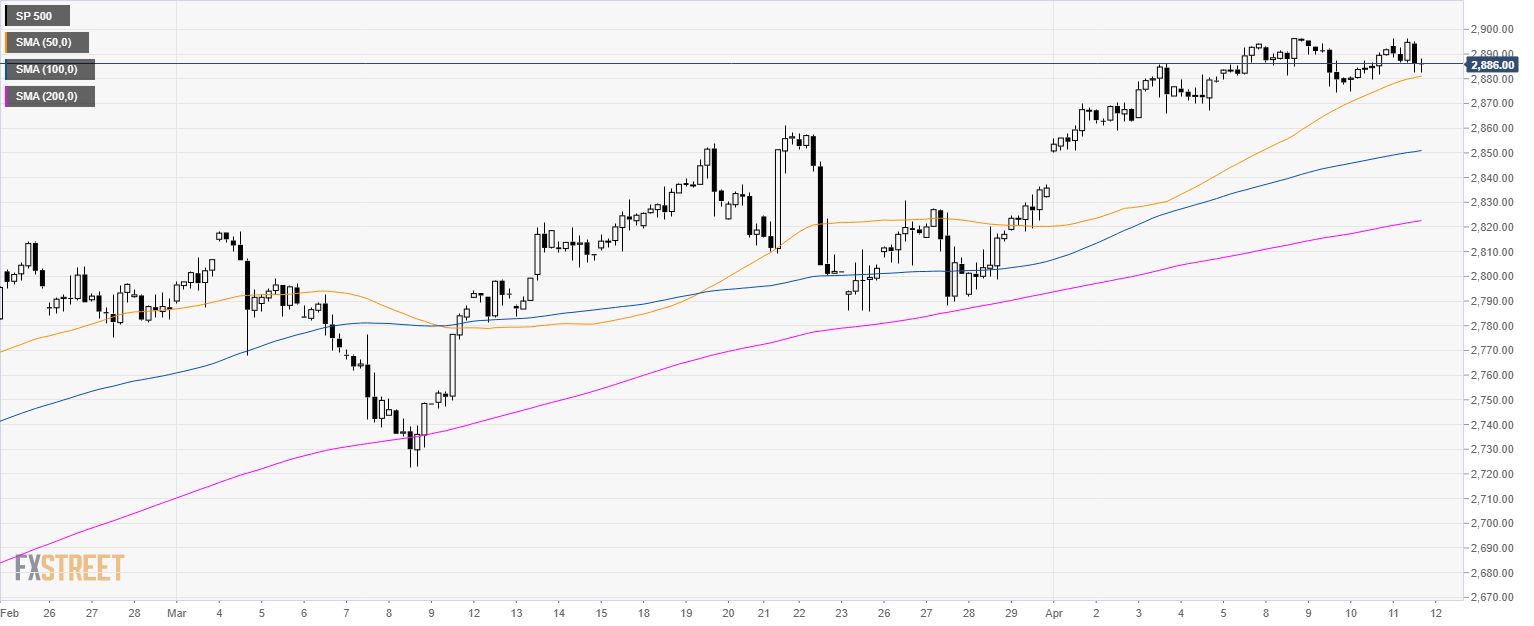
S&P500 4-hour chart
- The S&P500 is trading above its main SMAs suggesting a bullish bias in the medium-term.
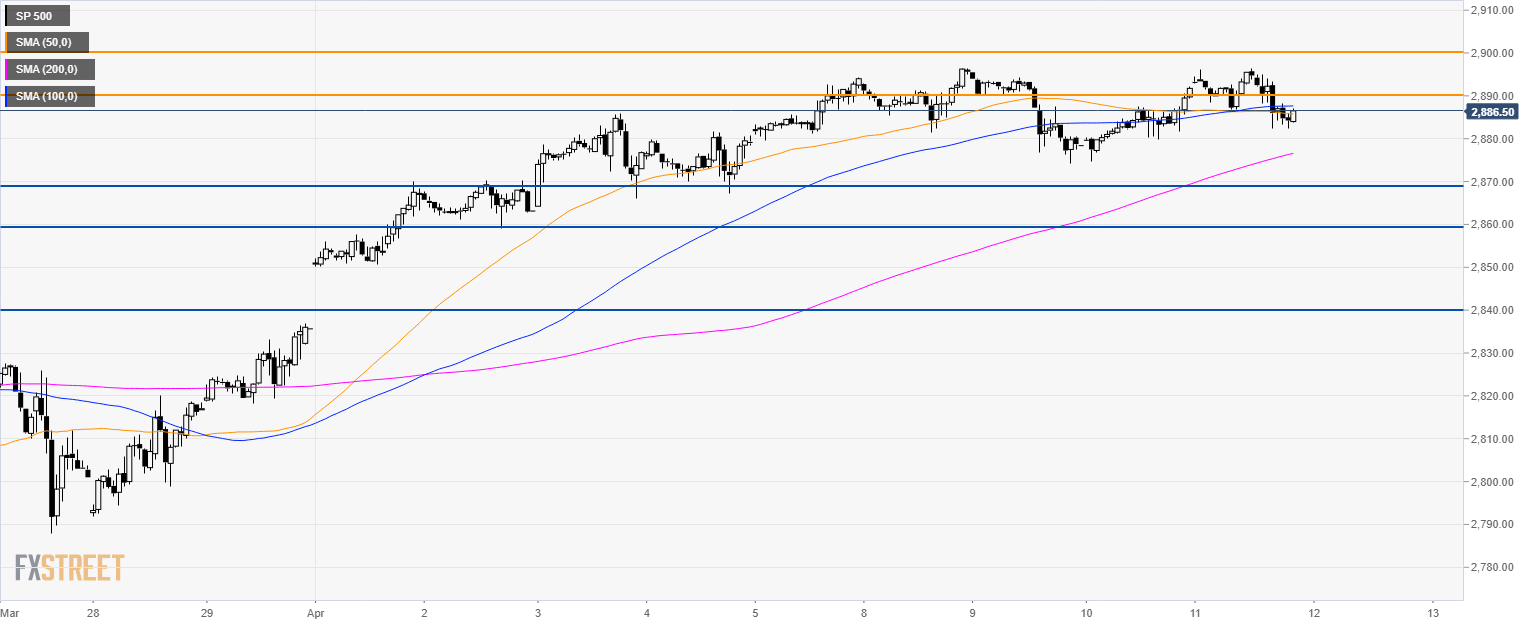
S&P500 60-minute chart
- The S&P500 is having a hard time to overcome 2,900.00 resistance while the 100 SMA crossed above the 50 SMA.
- If bears have a daily close below 2,870.00 the market can decline towards 2,860.00 and 2,840.00 support.
- To the upside, resistance is at 2,886.00 and 2,900.00 key resistance.
Additional key levels
