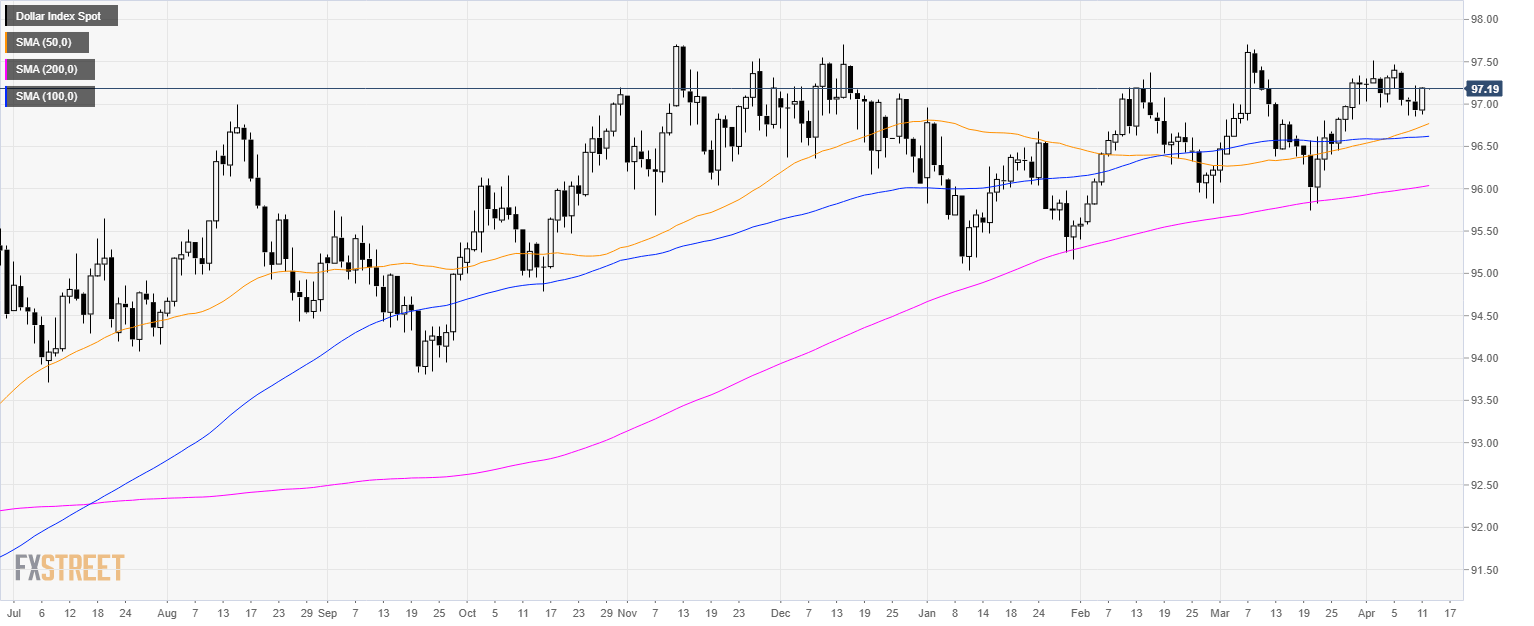
DXY daily chart
- The US Dollar Index (DXY) is trading in a bull trend above its 200-day simple moving average (SMA).
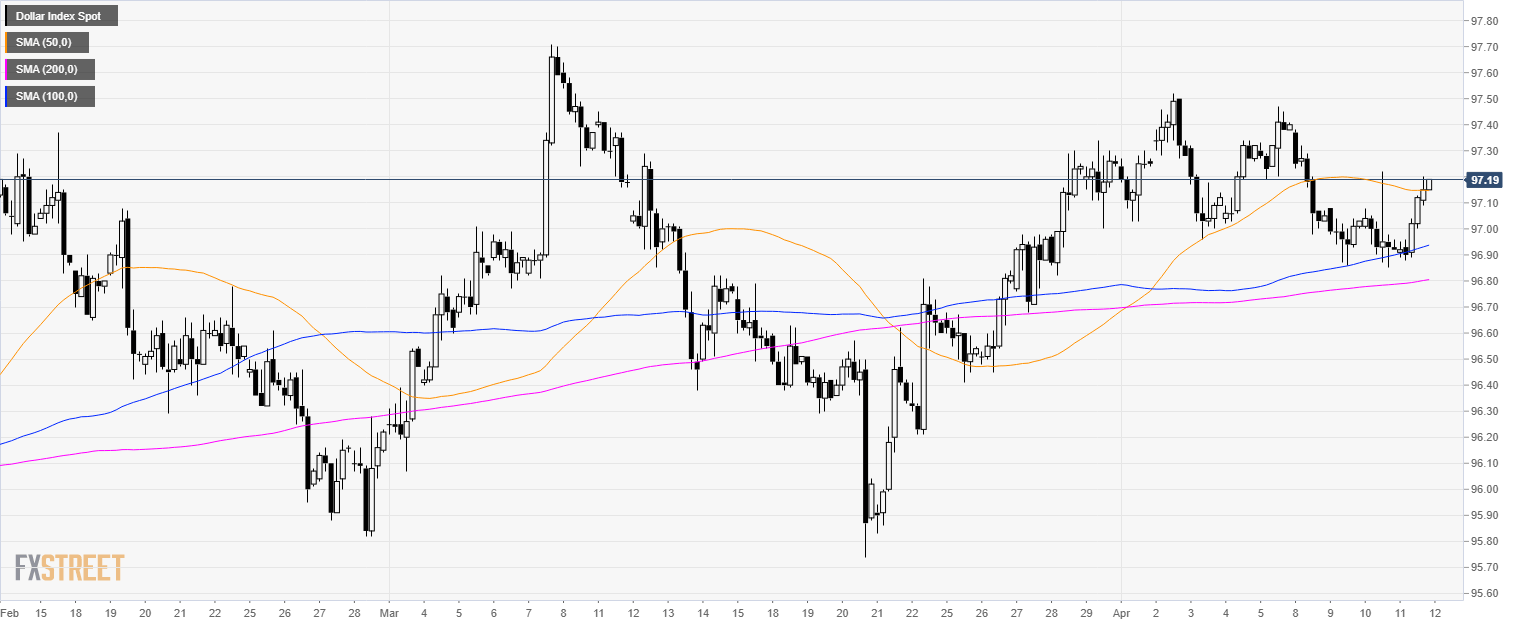
DXY 4-hour chart
- DXY bulls are challenging the 97.20 resistance while they broke above the 50 SMA. Is this the start of a new bull leg?
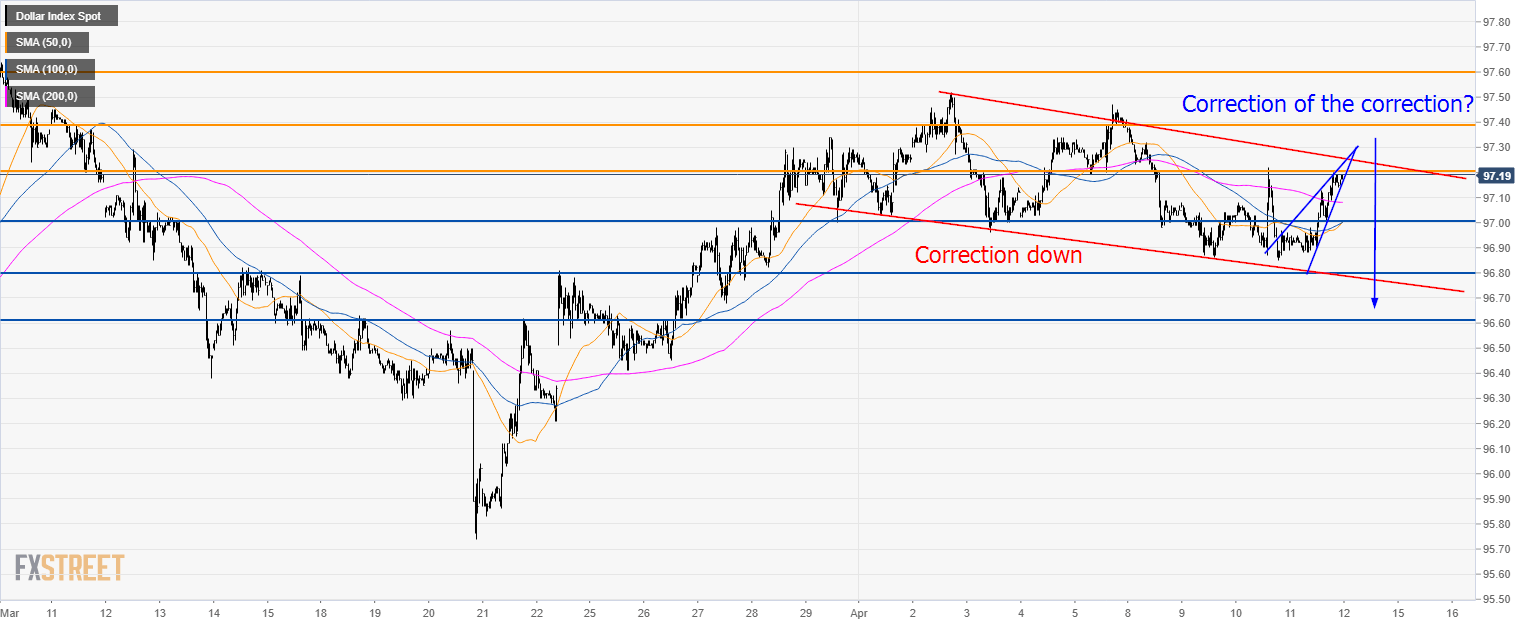
DXY 30-minute chart
- DXY is currently in a correction down. The recent advance can be considered a correction of the correction. Failure for bulls to move above 97.20 and 97.40 can lead to a resumption of the down move.
- Supports to the downside is seen at 97.00, 96.80 and 96.60 level.
Additional key levels
