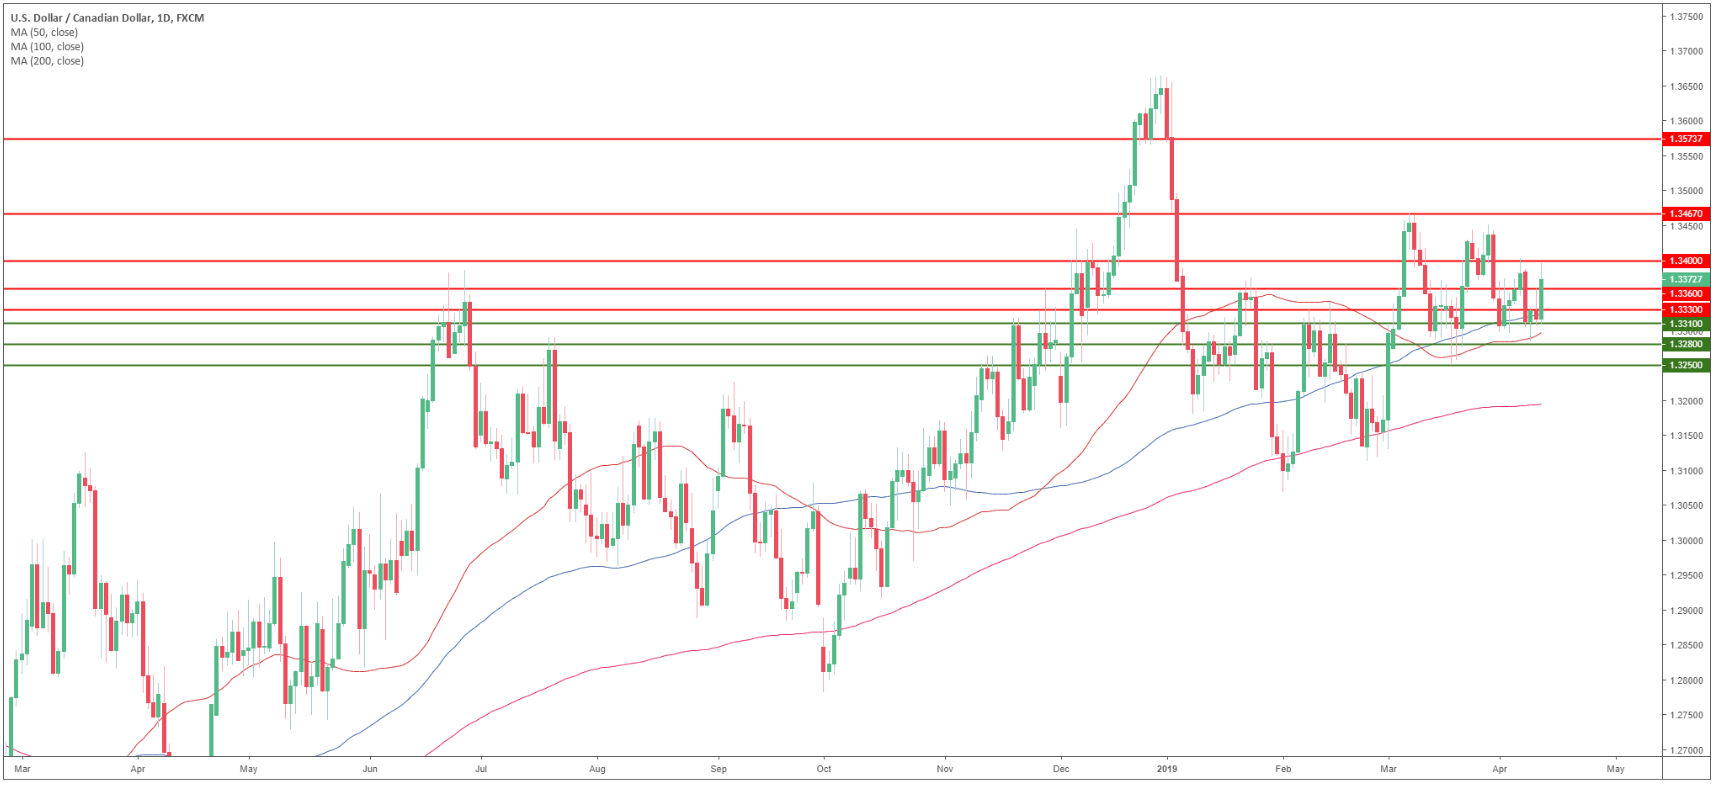
USD/CAD daily chart
- USD/CAD is trading in a bull trend above its 200 simple moving average (SMA).
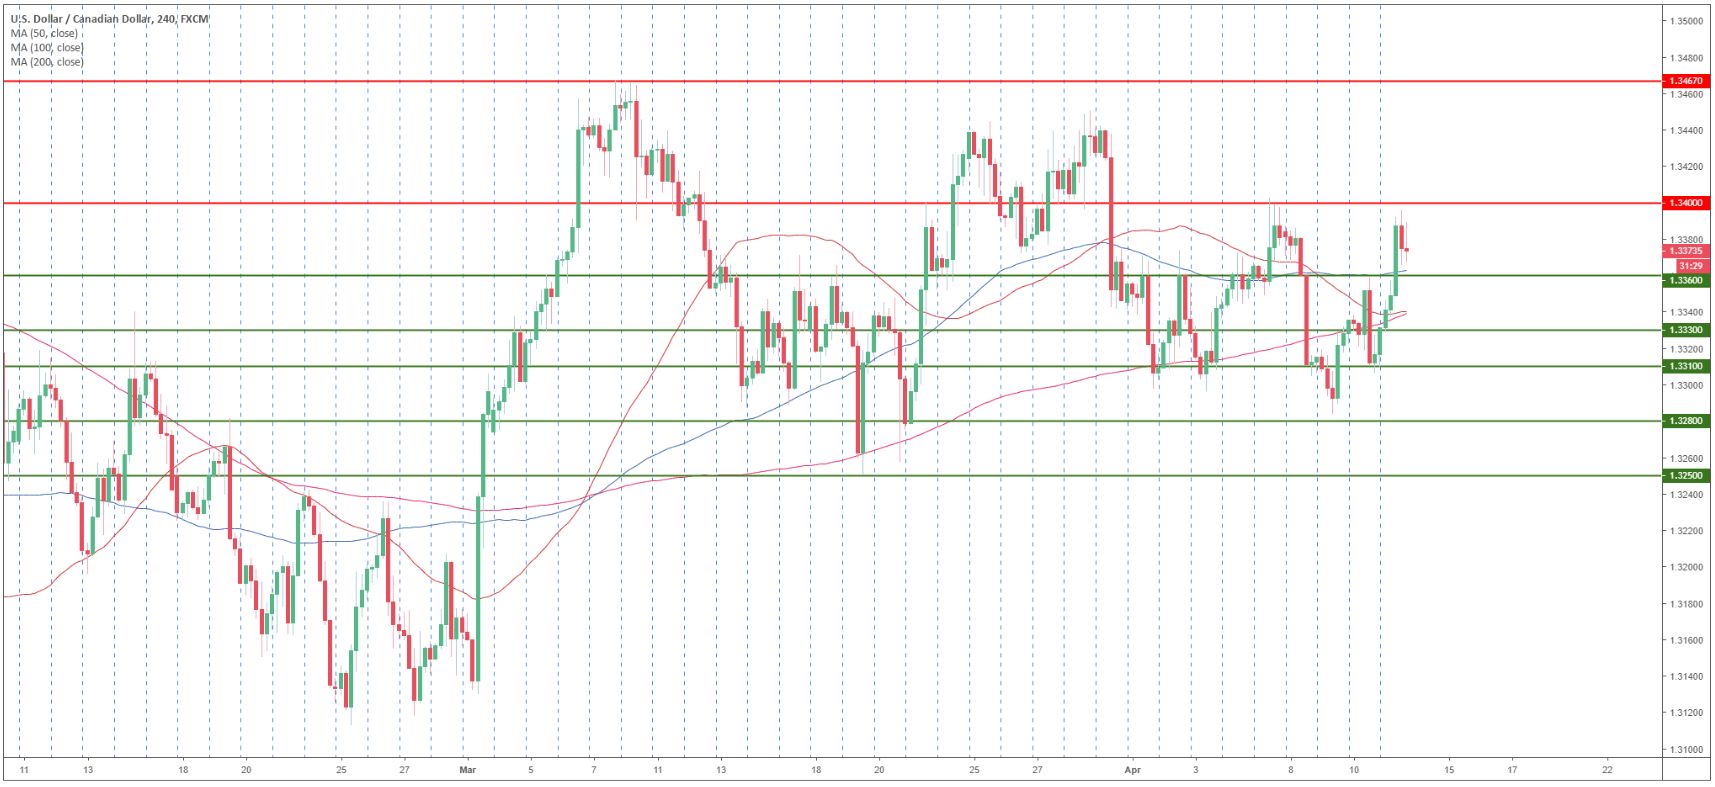
USD/CAD 4-hour chart
- USD/CAD is facing resistance at the 1.3440 level.
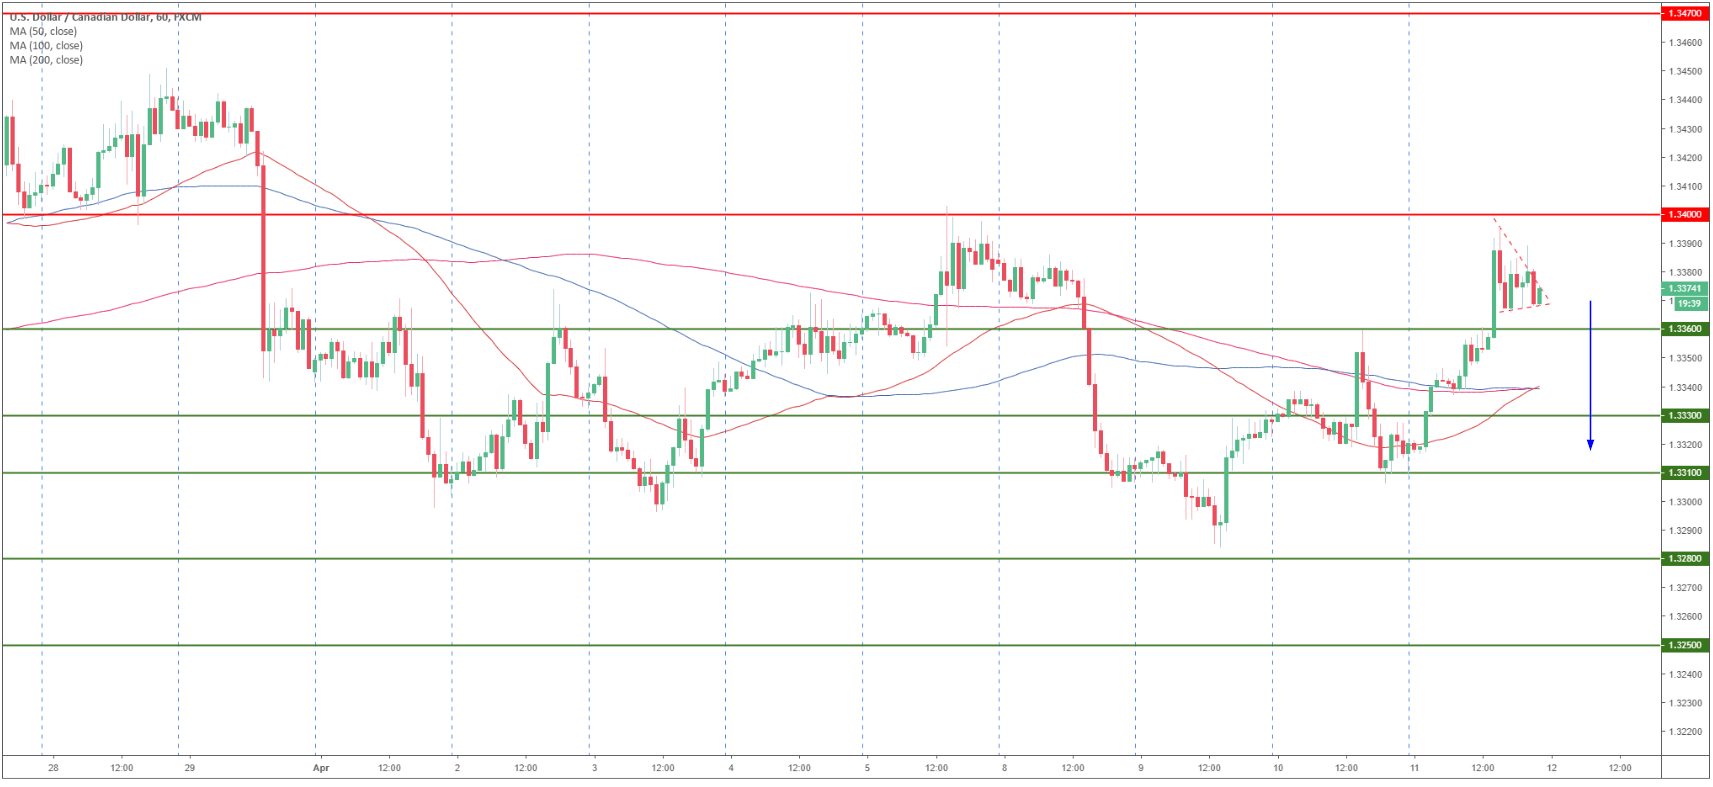
USD/CAD 30-minute chart
- The triangle pattern should send USD/CAD down towards 1.3360, 1.3330 and 1.3310 support.
- The bearish scenario would be invalidated on a bull break above 1.3440. The next main resistance is at 1.3470 level.
Additional key levels
