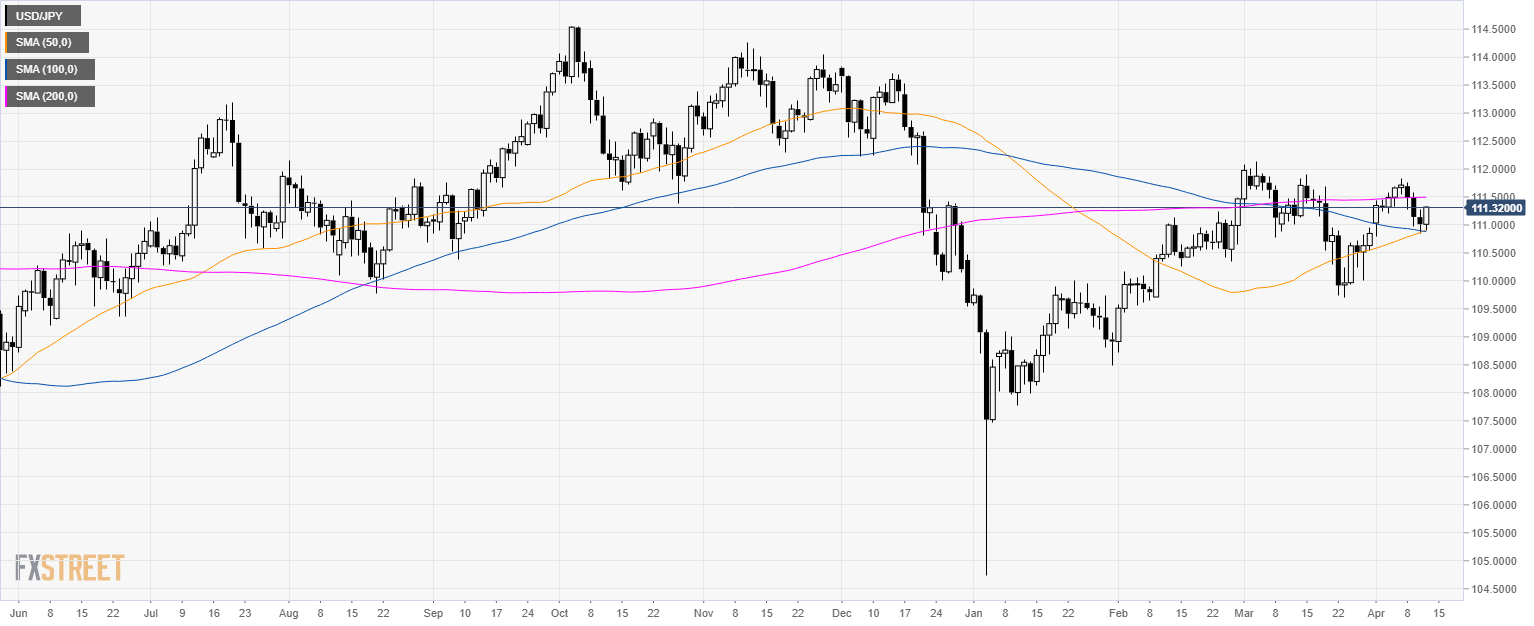
USD/JPY daily chart
- USD/JPY is trading below its 200-day simple moving average (SMA).
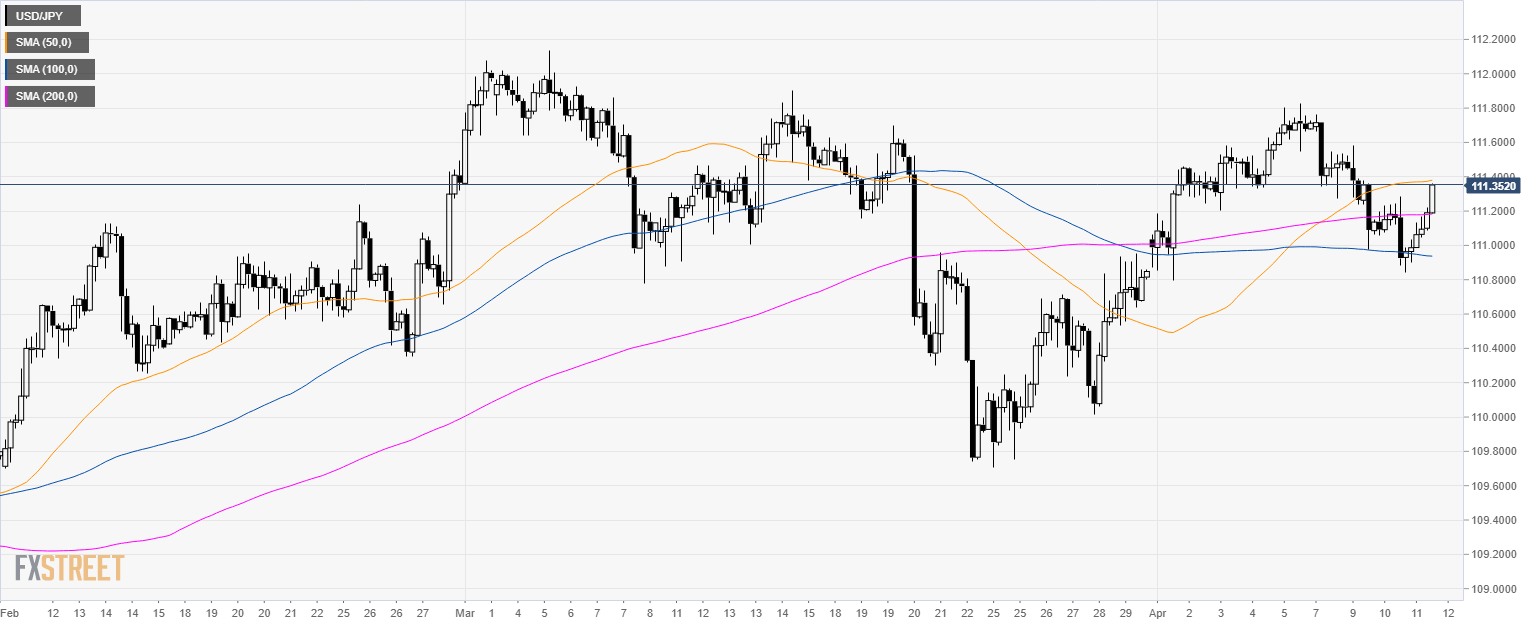
USD/JPY 4-hour chart
- USD/JPY is approaching 111.40 and the 50 SMA.
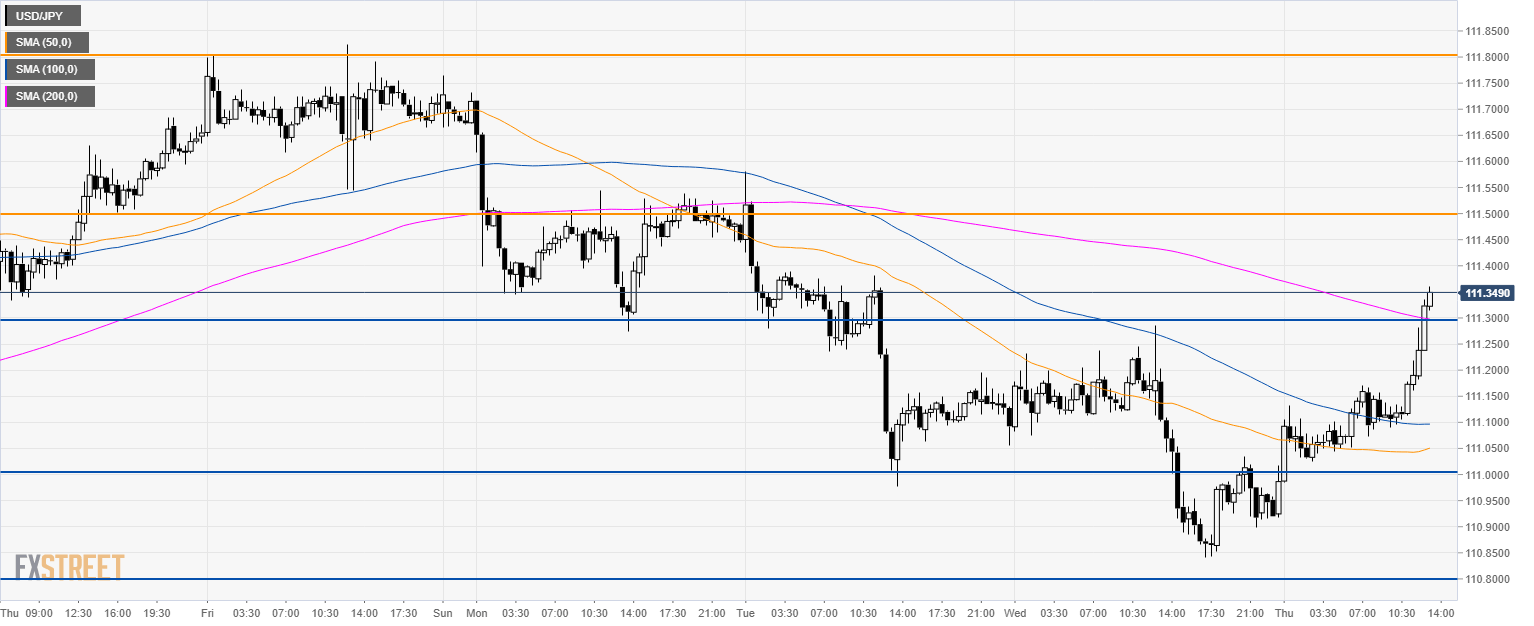
USD/JPY 30-minute chart
- USD/JPY broke above 111.30 resistance and the 200 SMA.
- The next main resistance is seen at 111.50 level.
- To the downside, support is seen at 111.30 and 111.00 level.
Additional key levels
