Gold trades near $1293 during early Friday. The yellow metal recently took a U-turn from seven-week-old downward sloping trend-line, forming part of the descending triangle.
Multiple highs between March 03 and 06 offer $1289.50 – $1289.00 immediate support, a break of which can drag prices to $1281/80 area which triggered the bullion’s bounces in last two months.
If at all sellers refrain from respecting $1280 support, 61.8% Fibonacci expansion (FE) of moves since February, near $1270-$1269.50 becomes crucial for them.
Meanwhile, $1300 round-figure and 38.2% Fibonacci retracement of February – April declines, at $1306, could act as nearby resistances ahead of highlighting the triangle’s upper-line at $1309.50 now.
Should there be increased buying beyond $1309.50, also clears $1310, chances of the quote’s rise to 61.8% Fibonacci retracement level of $1322 can’t be denied.
Additionally, the precious metal’s sustained growth past-$1322 can please bulls with $1333.00.
Gold 4-Hour chart
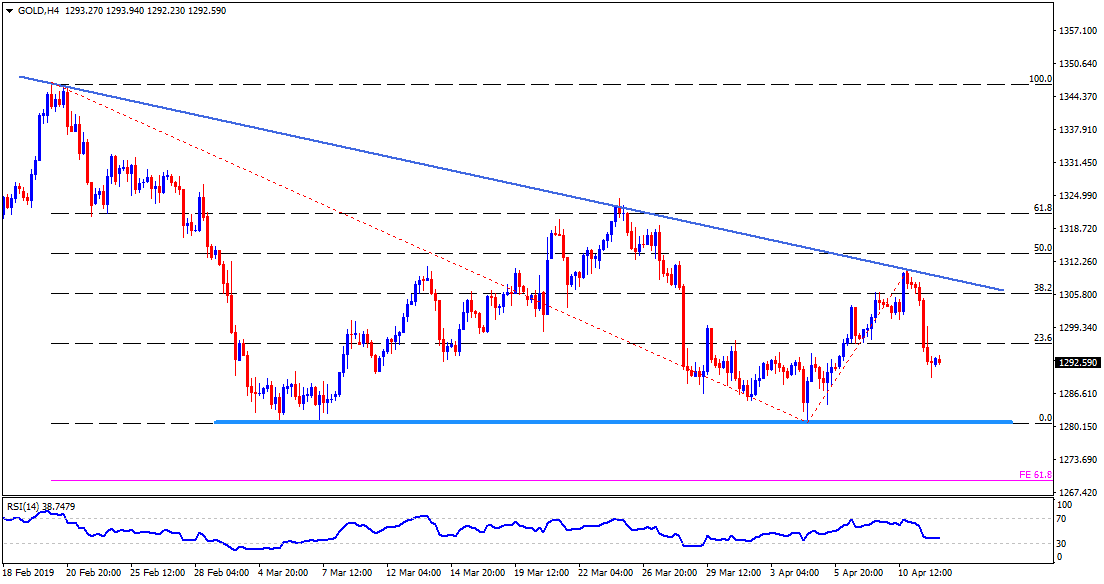
Trend: Bearish
