NZD/USD is on the bids near 0.6730 despite witnessing sluggish prints of the business NZ PMI and electronic card retail sales from New Zealand on early Friday.
The business NZ PMI lagged behind 54.4 market consensus to 51.9 whereas electronic card retail sales slumped -0.3% versus +0.7% forecast and +0.6% revised prior during the March month.
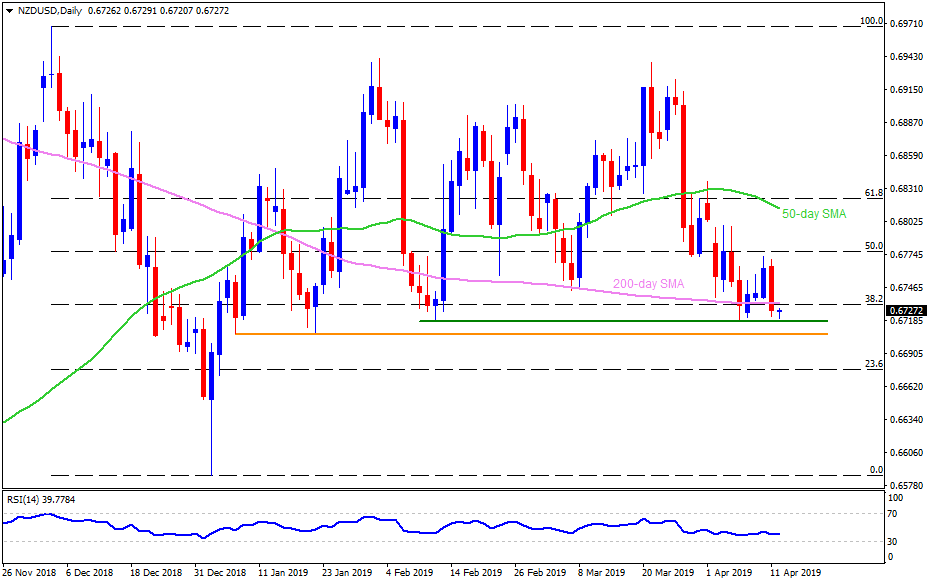
The NZD/USD pair has recently been respecting the horizontal-line connecting lows marked since February, near 0.6720. However, 200-day simple moving average (SMA) and 38.2% Fibonacci retracement of December 2018 to January downturn limits the quote’s upside around 0.6730/35.
As a result, prices are more likely to revisit 0.6720 and 0.6710 (a line joining lows after January 08) horizontal supports, unless breaking 0.6730/35 resistance-confluence.
Should pair drops under 0.6710, 0.6690 and 0.6650 seem crucial for sellers to watch as a break of which can recall 0.6600 and January lows near 0.6585.
Meanwhile, an upside clearance of 0.6735 enable the buyers to aim for 0.6770 and 0.6800 but 50-day SMA level of 0.6815 could challenge them afterward.
Additionally, pair’s sustained trading past-0.6815 enables it to target 0.6850 and 0.6875-80 numbers to the north.
NZD/USD daily chart
Trend: Sideways
