USD/IDR is trading near 14,150 while heading into European session on Friday.
The quote recently flashed an uptick beyond its 14,230 range-resistance but couldn’t rise past-14,260. However, 61.8% Fibonacci retracement of February 25 to March 08 upside near 14,120, followed by 14,110 range-support still stand tall to challenge sellers.
Should prices slip under 14,110, March 20 low near 14,055, followed by 14,000, can become bears’ favorites.
Assuming further south-run under 14,000 mark, 13,960 and 13,940 could come back on the chart.
During the pair’s upside beyond 14,260, a downward sloping resistance at 14,300 seems an important upside barrier as a break of which can escalate the moves to 14,350 and 14,370.
Moreover, bulls’ dominance above 14,370 should again highlight 14,420.
USD/IDR 4-Hour chart
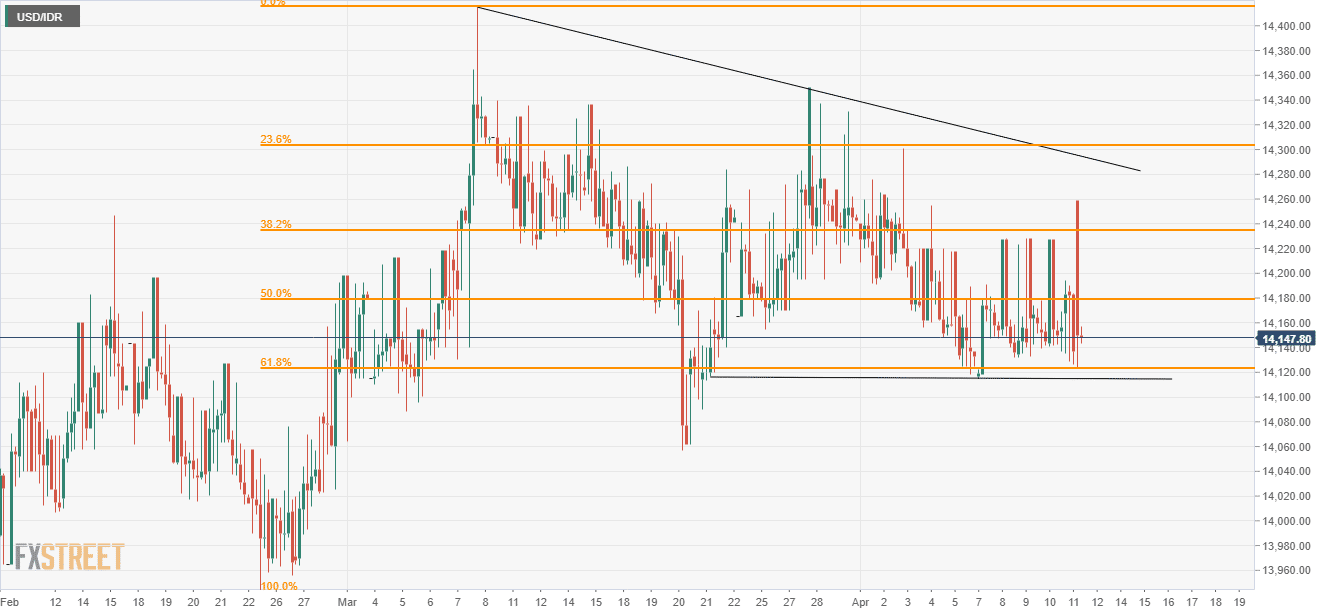
Trend: Sideways
