AUD/JPY holds its 200-day simple moving average (SMA) breakout intact while trading near 80.40 during early Monday.
The pair crossed the crucial SMA level for the first time in 2019 on Friday, signaling strength of underlying momentum.
However, 14-day relative strength index (RSI) reports overbought conditions and horizontal-region connecting mid-December lows around 80.65/75 is yet to be conquered, which in turn can question the 200day SMA break.
Should prices clear 80.75 upside barrier on a daily closing basis, 81.20, 81.70 and December 13 highs near 82.25 are likely following numbers to flash on the Bulls’ radar
Meanwhile, a downside break beneath 200-day SMA level of 80.25 may avail halt near 80.00 and 79.85 ahead of revisiting 79.65/60 support-zone.
In a case prices keep declining under 79.65, 79.40 and 79.00 – 78.95/90 area, including 50-day SMA and 61.8% Fibonacci retracement of December – January downturn, might grab the spotlight.
AUD/JPY daily chart
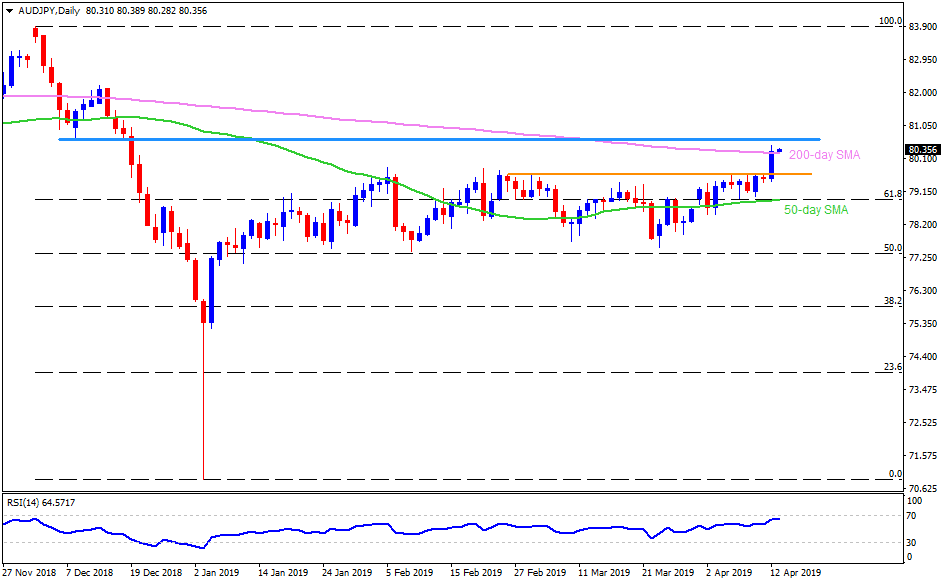
Trend: Bullish
