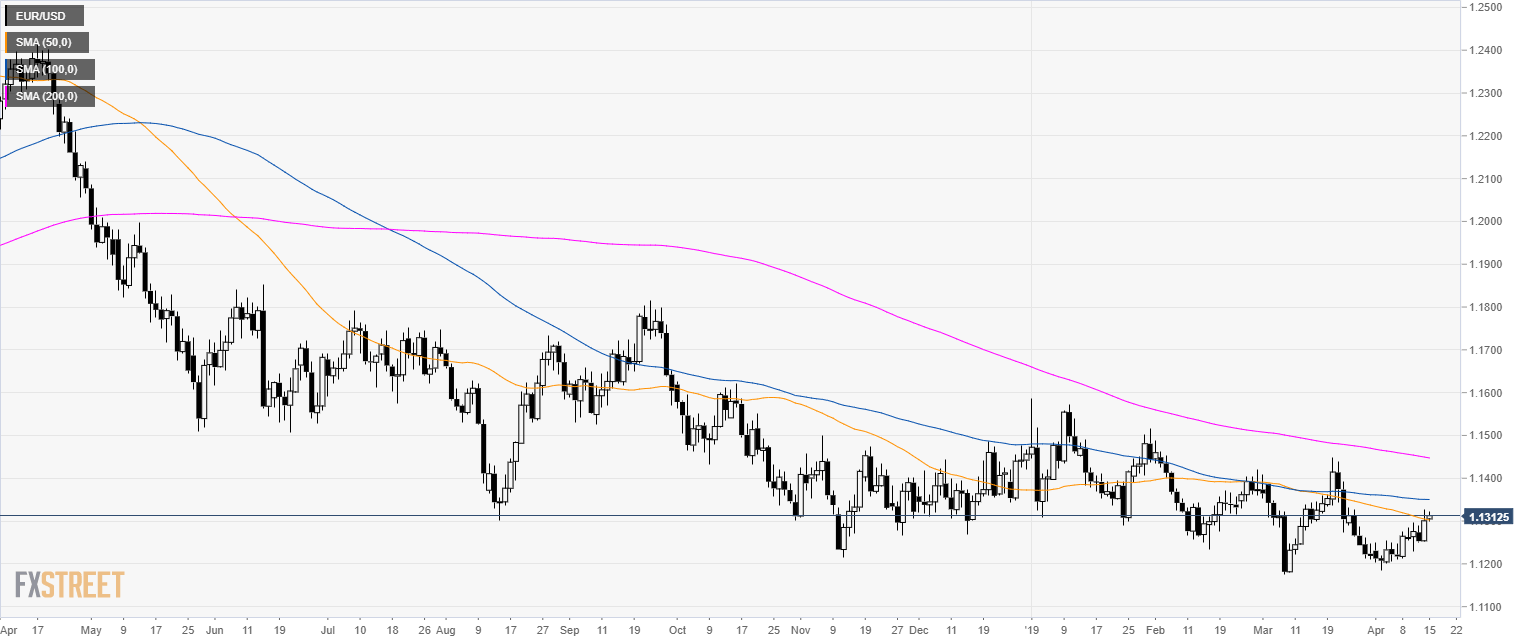
EUR/USD daily chart
- EUR/USD is trading in a bear trend below its 200-day simple moving average (SMA).
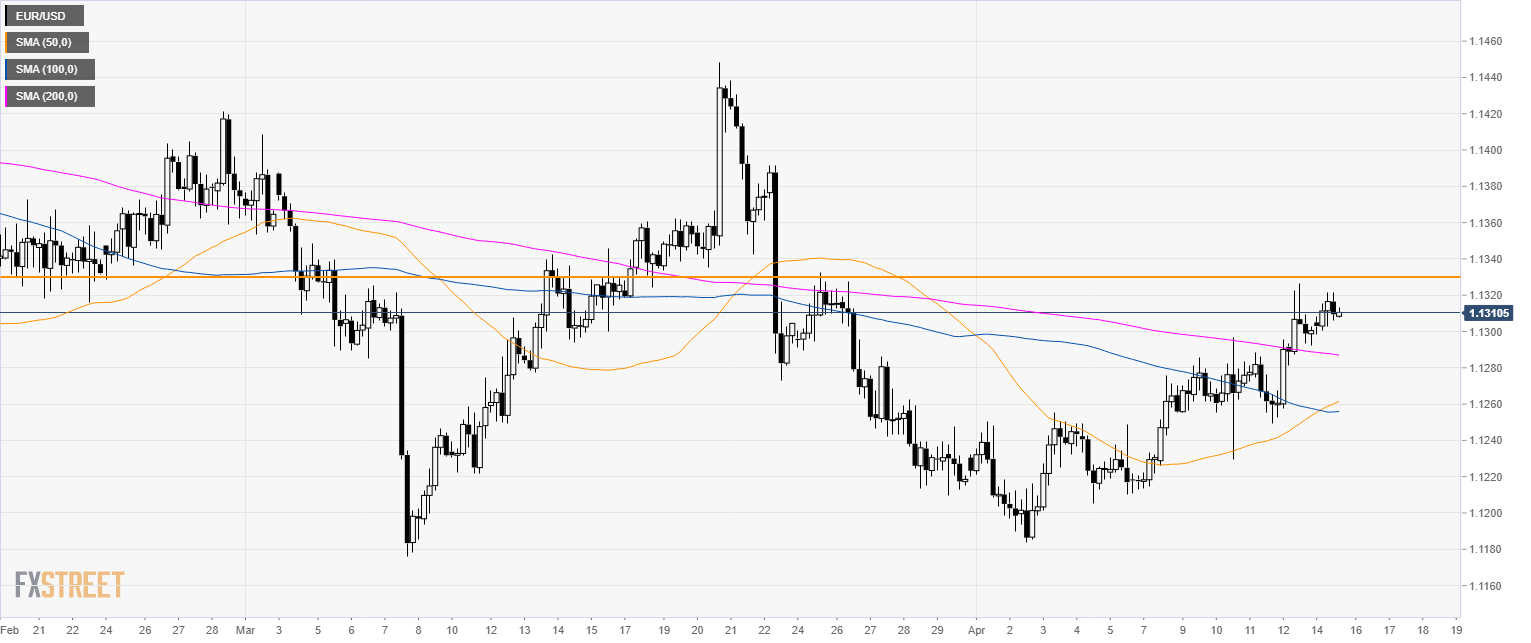
EUR/USD 4-hour chart
- EUR/USD is trading above the main SMAs suggesting a bullish bias in the medium-term.
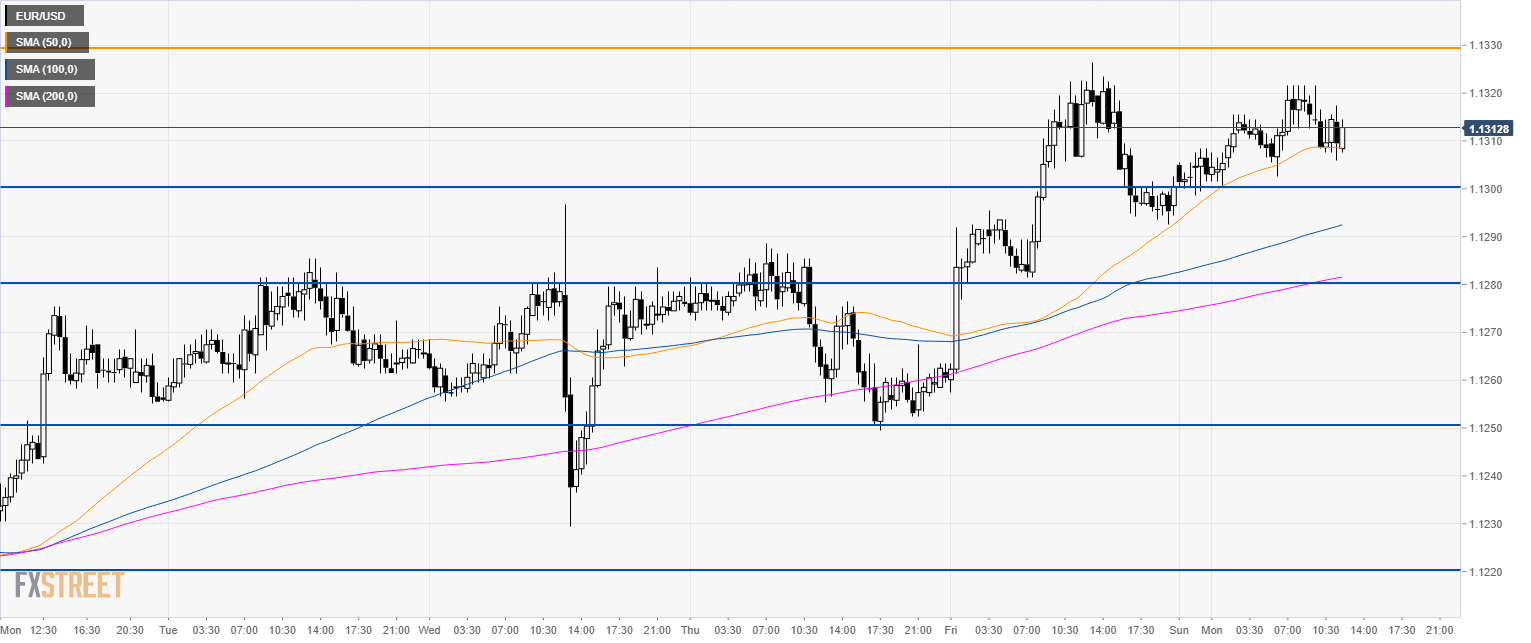
EUR/USD 30-minute chart
- EUR/USD found resistance at last Friday’s high suggesting that bulls might have run out of steam.
- The current weakness can initially expose 1.1300, 1.1280 and 1.1250 to the downside.
- The key resistance to break for bulls is 1.1330 followed by 1.1360 level.
Additional key levels
