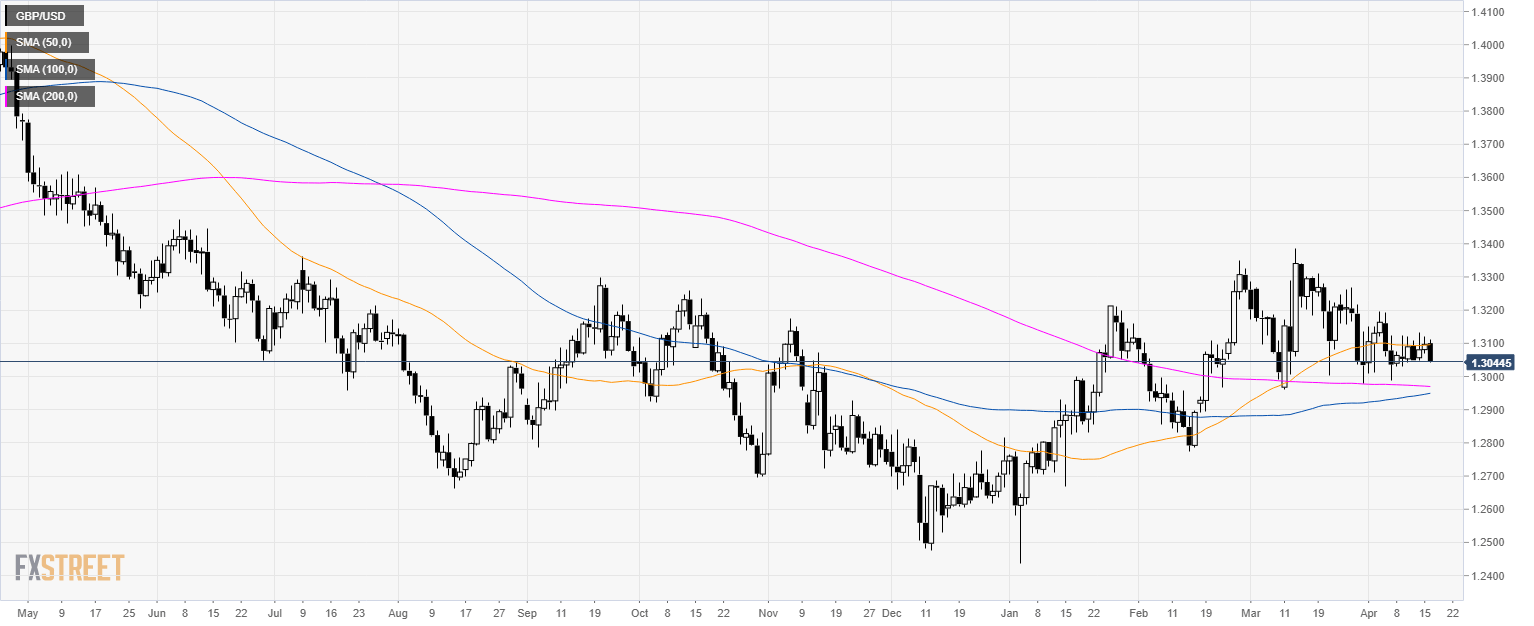
Home GBP/USD Technical Analysis: Cable drops to weekly lows near 1.3040 level
FXStreet News

GBP/USD Technical Analysis: Cable drops to weekly lows near 1.3040 level

GBP/USD daily chart

  • GBP/USD is consolidating below the 50-day simple moving average (SMA).  


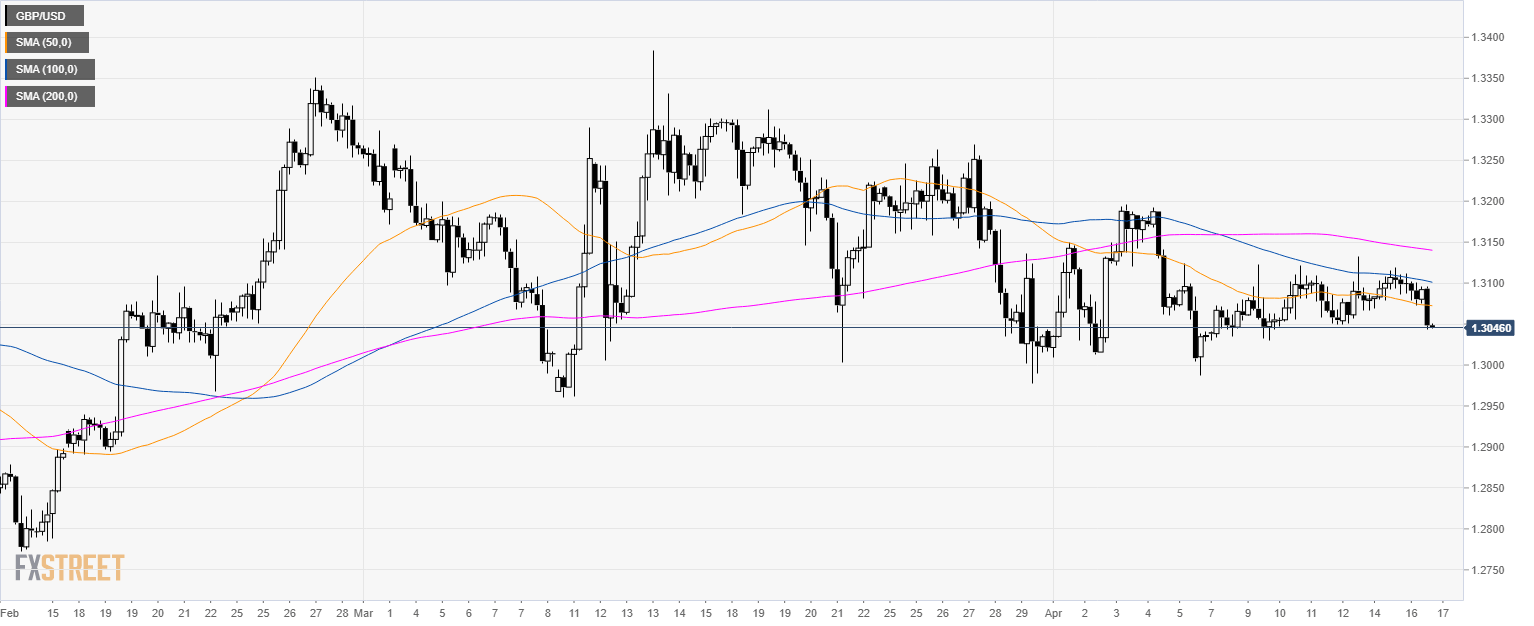
GBP/USD 4-hour chart

  • GBP/USD is trading below its main SMAs suggesting a bearish momentum in the medium-term.


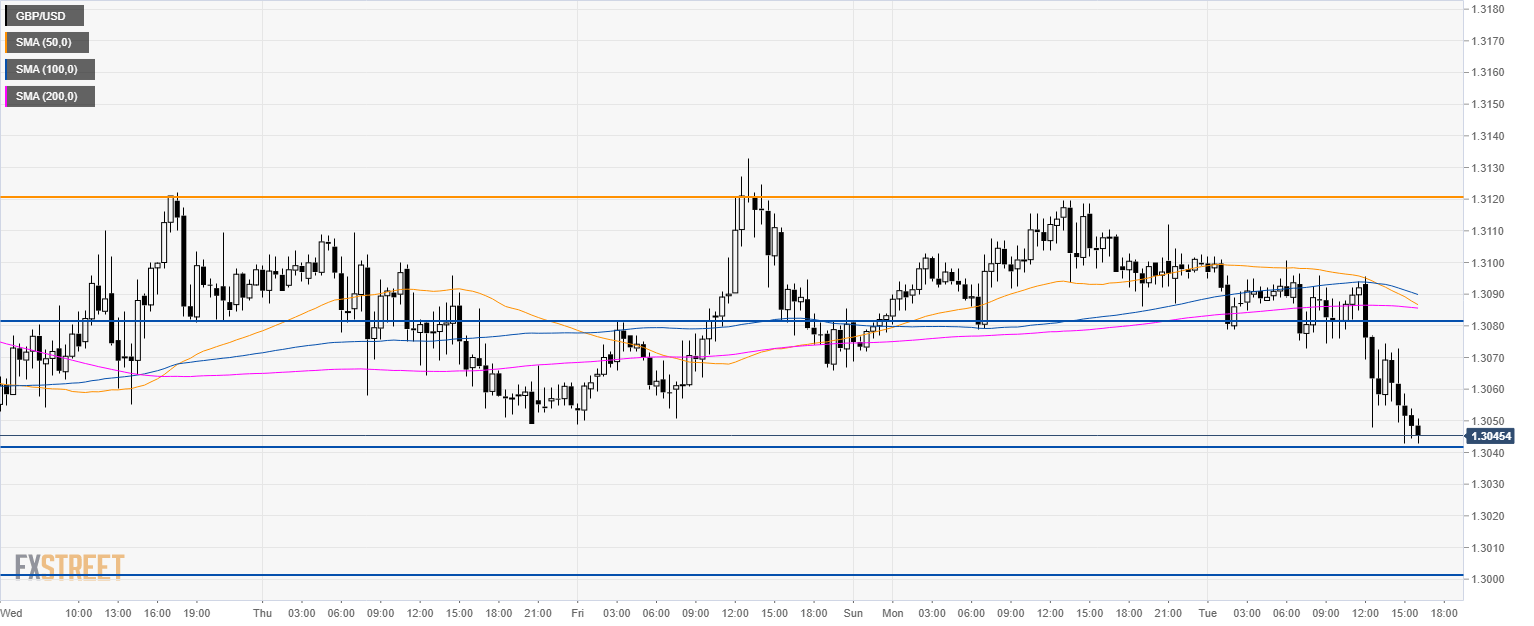
GBP/USD 30-minute chart

  • The market could  find some short-term support here at 1.3040 level.  
  • If broken then the next pit-stop for bears become 1.3000 the figure.
  • Resistance is at 1.3080 level.

Additional key levels


FX Street

FX Street

FXStreet is the leading independent portal dedicated to the Foreign Exchange (Forex) market. It was launched in 2000 and the portal has always been proud of their unyielding commitment to provide objective and unbiased information, to enable their users to take better and more confident decisions.